What
happens when one mixes a great timing indicator like the Dow Theory for the
21st Century (DT21C) with a relative strength system? Answer: Even more outperformance and a better
risk-reward profile v. Buy and Hold
(B&H).
Relative
Strength (RS) is based on the proven fact that assets (stocks, indexes,
sectors, commodities, etc.) that have displayed strength relative to other
peers should continue to be relatively stronger in the future. RS is not
trend-following, as one relatively stronger asset may be falling, albeit less
than its coequals. This is the weak point of RS investing. RS tends to
outperform in Bull markets but gets decimated in Bear markets. For many RS
systems, the risk-adjusted profile is not better than Buy & Hold due to
large drawdowns during Bear markets.
What
if we could get the upside of RS while getting rid of the downside? If we used
RS only in Bull markets and exiting stocks during downturns, we would be
getting the best of both worlds: Catching the RS’s outperformance in good times
while avoiding the bad times.
We know that
the DT21C is one of the best trend-following devices. This Dow Theory blog
provided ample evidence of the net superiority of the DT21C over another trend
following systems.
Thus,
if we applied an RS strategy to equities only when the DT21C is in a BUY mode,
we would have greater odds of achieving significant outperformance, as we’d
have two sources of outperformance:
the DT21C, and additionally,
the one derived from the RS strategy.
However, there are many RS strategies.
Some are good and robust. Some are not. After carefully researching the issue
since 2015 and testing the waters with my own accounts, I came to what I
consider one of the “best” and most robust RS systems. The test starts on 1/06/01 and finishes on 12/31/22, ca. 21 ½ years. Take
a look at the key charts and figures:
Below there is the performance breakdown
for each year from 2001 to 2021:
Key performance figures:

I
calculated the profit factor (PF,
total profits made divided by total losses, see row “K” above) by computing the
yearly percentage changes for each strategy and adding the total percentages of
points won (row “H”) or lost (row “I”). We see that the DT21C almost doubled
the PF of B&H (6.12 v. 3.63). The
DT21C+RS scored an astounding PF of 22.33, which means that we made much more
than we lost, and, more importantly, a high degree of accuracy at spotting
trends. We can also observe that by using a good trend filter (the
DT21C), we get rid of the drawback plaguing RS systems: huge drawdowns
during bear markets. If you look at the “Total Loss” cells (row “I” above),
you’ll see that the DT21C has a smaller total loss (as expected in good
trend-following) but the DT21C+RS had an even more minuscule total loss
of -12.09% percentage points over the last 21 years. In other words, by mixing RS with the DT21C, we increased performance,
but we did not increase drawdowns. Given its propensity to significant
drawdowns during bear markets, this is quite a feat when dealing with an RS
strategy.
One
approximation to a risk-adjusted measure of performance is to divide the
average annual performance (row “A” above) by the annual standard deviation of
such performance (row “B”). B&H scored a decent 0.51 (it’s been a secular bull
market after all), the DT21C had a better reading of 0.66 (it was better on
both counts: more performance and less volatility). The DT21C+RS system scored
an exceptional 0.88 (row “C”), which implies that we are increasing performance
and decreasing risk. Another way to measure whether we are doing an excellent
job at keeping drawdowns at bay is to subtract one standard deviation of the
annual returns from the average annual returns themselves (row “D”): The less
negative the number, the lower the odds of enduring a big drawdown in the
future.
Row
“E” shows the Compounded Annual Growth Rate (CAGR). As expected, it is higher
for the DT21C and much higher for the DT21C+RS. Please remember that CACR gives
us a more accurate performance measure than the average annual return (row
“A”). However, measuring the average yearly return is helpful in order to
relate it to its standard deviation to appraise risk.
The DT21C+RS system
only had two modest negative years (row “F”). B&H had four negative years.
The worst annual performance (“Max Loser,” row “G”) was -38.48% for B&H, a
very decent -13.54% for the DT21C, and an outstanding
-8.30% for the DT21+RS. So despite being an RS strategy, we
managed to reduce drawdowns significantly thanks to the use of the DT21C trend
filter.
The correlation
coefficient of the annual performance of B&H v.
The DT21C is 0.789. Given that the DT21C was tested on the
S&P500, we see that the DT21C is not so correlated to B&H, which makes
itself evident by slightly underperforming when the market is strong and
overperforming when the market falls. The correlation
between the DT21C+RS and B&H is more interesting, dropping to a more modest
0.618. Thus, adding the RS element to the DT21C provides an additional layer of diversification.
We are achieving more outperformance and decoupling ourselves from the vagaries
of B&H.
Watch
out! There is no holy grail in the markets. We are not going to have the wind
at our backs all the time. While over the long term, DT21C+RS beats the pants
of B&H, there are rough patches that we have to overcome psychologically.
Out of 21 years tested, DT21C+RS outperformed B&H for a total of eleven
years. However, B&H defeated the DT21C+RS ten years. So there is an almost
50% chance that in any given year, we will be underperforming. Furthermore,
there have been two episodes of 3-years-in-a-row of underperformance. The good
news is that underperformance is not a lack of performance, and our DT21C-RS
system fared well during the underperforming years but less than B&H.
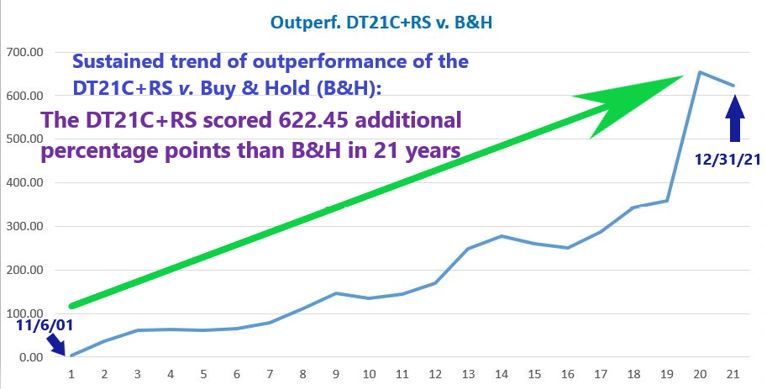
The
chart below shows the cumulated outperformance of the DT21C+RS versus B&H:
As
you can see, the uptrend of outperformance is clear. Furthermore, you may
observe that the periods of underperformance (blue line going down) are short-lived
and moderate. In other words, the DT21C+RS will spend less time underperforming
B&H than the DT21C or RS alone. This insight is vital as time
underperforming B&H wears out the investor’s patience. The shorter we keep
the time underperforming B&H, the more likely we will stick to our
trend-following system in real life.
Well, now it's time to open the black box and discuss the rules of our Relative Strength + DT21C strategy, namely:
1. Selecting our universe (find the right assets to trade).
2. How to select the highest relative strength assets.
3. How to rank.
4. Buy, Sell, and rotation rules.
5. How do we avoid the risk of a crowded trade.
6. Suggested alternatives to improve performance further.
.................................... ............................ .......................................
Do you want to continue reading?
Do you want to know the rules of
our top outperforming DT21C+Relative Strength system, and learn to trade it?
Become a
Subscriber, and you’ll have access to the full Special Report. Furthermore,
we will be informing our Subscribers of the trading candidates we will be selecting according to
our new strategy.
Additionally,
your subscription will give you a wealth of information (i.e., access to our
Letters since 1962 and their accompanying trade recommendations, the power of
the consumer confidence report as a timing device, the special report about the
yield curve, how to calculate profit objectives that work, trend assessment for gold, silver and their ETF miners -GDX & SIL- and much more). More
importantly, you’ll be punctually updated through our email service of any
change in the trends for US stock indexes. Not accidentally, our Newsletter has consistently been ranked
among the top investments Letters.
What are you waiting for? Our new
strategy scored 622.45 additional percentage points than Buy & Hold in 21
years. It can be rightly named Dow Theory on steroids.
Subscribe NOW!
Sincerely,
Manuel Blay
Editor of
thedowtheory.com