Wednesday, November 17, 2021

Dow Theory Update for November 17: Secondary reaction against the primary bear market and setup for a potential Bull market signal in US Bonds


Primary and secondary trends for precious metals, their metals, and US stocks remain bullish.


I am writing before the close. So please do your own homework. 


US INTEREST RATES


General Remarks:


In this post, I provided a thorough explanation concerning the rationale behind my use of two alternative definitions to appraise secondary reactions.


TLT is the iShares 20 years + Treasury bond ETF. More about it here


IEF is the iShares 7-10 years Treasury bond ETF. More about it here.


Thus, TLT tracks longer-term US bonds, whereas IEF tracks middle-term US bonds. A bull market in bonds entails lower interest rates. A bear market in bonds represents higher interest rates.


A) Market situation if one appraises secondary reactions not bound by the three weeks and 1/3 retracement dogma.


The primary trend was signaled as bearish on 9/28/21, as was explained here.  


TLT made its hitherto last primary bear market closing lows on 10/11/21. IEF did so on 10/21/21. Off their respective bear market lows, TLT rallied for 21 trading days until 11/9/21 and IEF for 13 trading days until 11/9/21. Accordingly, the time requirement for a secondary reaction has been met. And what about the extent requirement? As you can see in the table below, it has also been met, as both TLT and IEF rallied more than the Volatility-Adjusted minimum movement (VAMM).


Following the secondary reaction closing highs, both ETFs have declined for 5 trading days until 11/16/21. TLT’s drop exceeded the VAMM. IEF’s decline did not reach the VAMM. However, we don’t require confirmation for the pullback following a secondary reaction as was explained in depth here


Therefore, a setup for a potential primary bull market signal has been completed.


Now we have two alternative options:


a) Either the primary bear market lows (10/11/21 for TLT and 10/21/21 for IEF, respectively) are jointly broken down, in which case the primary bear market would be reconfirmed, and the secondary reaction would be terminated.


b) or, the 11/9/21 secondary reaction closing highs get jointly broken up in which case a primary bull market would be signaled. 


Please find below the updated charts for TLT (top) and IEF (bottom). The blue horizontal lines display the closing highs of the secondary reaction which are the relevant price levels to be broken topside for a primary bull market signal to be given.
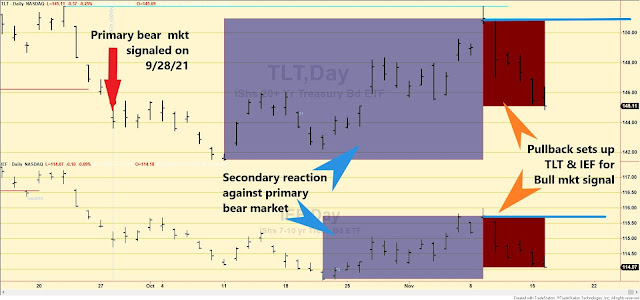

If the blue horizontal  lines (ride side of the charts) were  jointly broken up, a primary bull market would be signaled. Let's wait and observe.


B) Market situation if one sticks to the traditional interpretation demanding more than three weeks and 1/3 confirmed retracement to declare a secondary reaction.


The primary trend was signaled as bearish on 9/28/21. A more aggressive and legitimate interpretation would have signaled the bear market on 9/24/21. The explanations here.


TLT has rallied 21 trading days off its 10/11/21 bear market lows. IEF only rallied 13 trading days off its 10/21/21 bear market lows. So, if we adhere to the “strict” (and distorted) interpretation of the Dow Theory, we cannot declare the existence of a secondary reaction yet, as the time requirement has not been met. Absent the time requirement, no secondary reaction has been signaled. Thus, both the primary and secondary trends remain bearish.


 Sincerely,

Manuel Blay

Co-Editor of thedowtheory.com


Tuesday, November 16, 2021

Dow Theory Update for November 16: Recap of the Dow Theory outperformance across many markets

 GLD/SLV, GDX/SIL, USO/XLE, TLT, and the Dow Industrials

Is the Dow Theory only for US stock indexes? Does it work? Is it not a thing of the past? The Dow Theory works and outperformed Buy & Hold across many markets (energy, precious metals, and their ETF miners, US bonds, US stock indexes). Look at the chart below. It displays the outperformance of the Dow Theory versus Buy & Hold as per the trades taken in this blog and on thedowtheory.com (US Stock Indexes since 1953) from the end of August 2012 till June 2021.


And what about risk? The Dow Theory did a great job too, as you will see soon on this blog.


Recap of all trades taken on this blog since the end of August 2012 to June 2021


Sincerely,

Manuel Blay

Co-Editor of thedowtheory.com
 

Saturday, November 13, 2021

Dow Theory Update for November 13: Primary bull market signaled for gold, silver, and their ETF miners on November 11th


Secondary reaction against the primary bear market in US bonds


GOLD AND SILVER


In this post, I provided a thorough explanation concerning the rationale behind my use of two alternative definitions to appraise secondary reactions.


A) Market situation if one appraises secondary reactions not bound by the three weeks dogma.


The primary trend was signaled as bearish on 8/6/2021, as was explained here.


Starting off the 9/29/2021 bear market closing lows, a secondary reaction developed. The secondary reaction did not result in a setup for a primary bull market, as we did not get a pullback on at least one ETF exceeding the volatility-adjusted minimum movement (VAMM). More about VAMM here


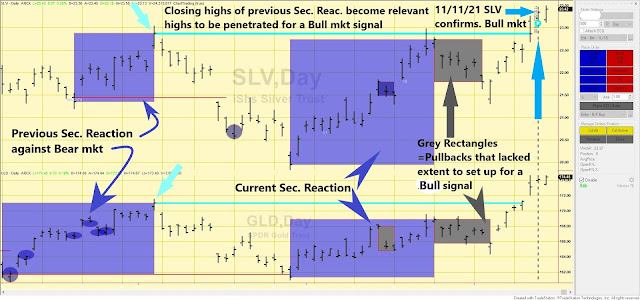
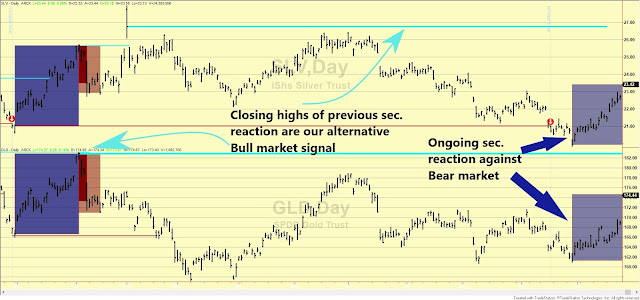
Absent the “normal” setup, our alternative break-up point is the closing highs of the last (previous) completed secondary reaction. I refer to this post for a more in-depth explanation. A confirmed break-up of 09/03/21 closing highs @ 171.06 and 22.88 for GLD and SLV, respectively, entails a primary Bull market signal. GLD was the first to break up on 11/9/2021 (see blue horizontal  line on the bottom chart below). SLV confirmed on 11/11/2021. Hence, on 11/11/2021, a primary bull market was signaled. The secondary trend is bullish too. 


Here you have the updated charts. The blue horizontal lines show the closing highs of the last (previous) completed secondary reaction which in this case were the relevant price levels to be broken  topside for a primary bull market signal. The purple rectangles display the past and the current secondary bullish reactions. The grey rectangles display a pullback on both GLD & SLV which lacked enough extent to set up both ETFs for an  "ordinary" primary bull market signal.


B) Market situation if one sticks to the traditional interpretation demanding at least three weeks of movement to declare a secondary reaction.


The primary trend was signaled as bearish on 11/27/2020, as was explained here.


The primary bear market was reaffirmed on 9/17/2021, as was explained here


The rally off the 9/29/2021 closing lows until 11/12/2021 has lasted until now 32 trading days. Accordingly, the time requirement for a secondary reaction (at least 15 confirmed days) has been more than met (it was already met many days before). Percentage-wise the extent requirement was also met. The Table below displays the situation on 10/25/2021. You can see that by that date the time and extent requirement had been already fulfilled.


No pullback with enough extent has occurred, so we don’t have the setup for a primary bull market signal. As to the alternative Bull market signal, the highs of the last completed secondary reaction remain at a lofty level (see blue horizontal lines on the charts below). So no primary bull market signal for the time being. More info about this vital alternative way of signaling primary bull and bear markets here. Ignore it at your own peril. 


GOLD AND SILVER MINERS ETFs


A) Market situation if one appraises secondary reactions not bound by the three weeks dogma.


 The primary trend was signaled as bearish on 8/9/2021, as was explained here.


Starting off the 9/29/2021 bear market closing lows, a secondary reaction developed. The secondary reaction did not result in a setup for a primary bull market, as we did not get a pullback on at least one ETF exceeding the volatility-adjusted minimum movement (VAMM). More about VAMM here.


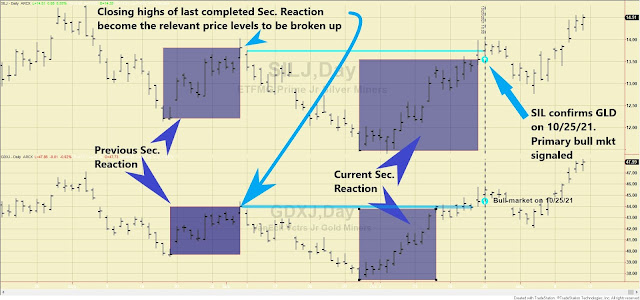
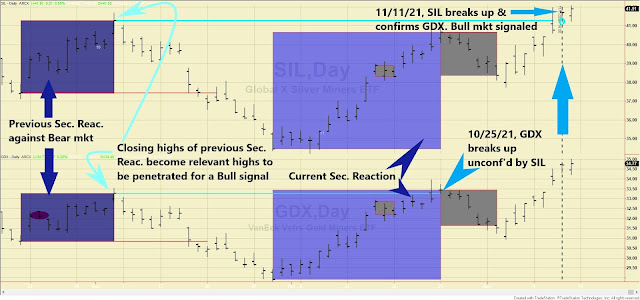
Absent the “normal” setup, our alternative break-up point is the closing highs of the last (previous) completed secondary reaction. I refer to this post for a more in-depth explanation. A confirmed break-up of 09/03/21 closing highs @ 33.28 and 41.28 for GDX and SIL, respectively (highs of the last completed secondary reaction for want of an earlier entry point), would signal a primary Bull market. On 10/25/21, GDX, by closing at 33.45, exceeded its respective closing high unconfirmed by SIL. On 11/11/21, SIL finally confirmed, signaling, accordingly, a primary bull market. The secondary trend is bullish too. 


Here you have the updated charts. 


 By the way, the junior miners, GDXJ and SILJ, signaled a primary bull market on 10/25/2021. Look at the charts below. Usually, multi-market confirmation raises the odds for a successful trade, as explained here:


B) Market situation if one sticks to the traditional interpretation demanding at least three weeks of movement to declare a secondary reaction.


The primary trend was signaled as bearish on 8/9/2021, as was explained here.


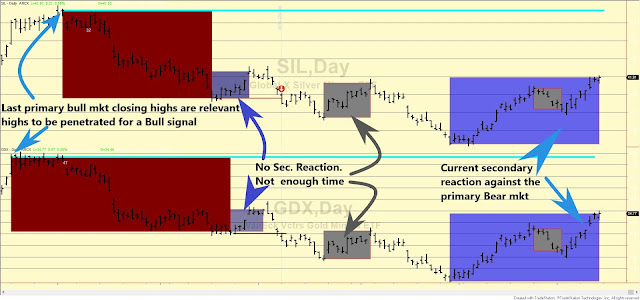
Off the 9/21/2021 closing lows until 11/12/2021, there was a rally that qualifies as a secondary reaction against the primary bear market. In this specific instance, the secondary reaction coincides with the one appraised when taking a shorter-term perspective (see above). As of this writing the setup for a primary bull market has not been completed since we did not get a pullback of enough magnitude on at least one ETF. In our specific instance, our alternative definition for a primary bull market are the closing highs of the last primary bull market (blue horizontal lines on the charts below). 


Overview:

The spreadsheet below displays the primary trend in the pairs SLV/GLD and SIL/GDX when we appraise them with either the “shorter-term” or longer-term interpretation of the Dow Theory. Red color displays a primary bear market, and blue displays a primary bull market.


Sincerely,

Manuel Blay

Co-Editor of thedowtheory.com

Tuesday, November 2, 2021

Dow Theory Update for November 2: Classical Dow Theory. Primary bull market reconfirmed today


Trends for gold, silver and their ETFs miners and interest rates unchanged.


US STOCKS


“Rhea’s /classical" Dow Theory


Today, 11/2/2021, the Dow Transportation finally confirmed the Dow Industrials in bettering its last bull market highs (5/7/21). As per the "original" Dow Theory, it means:

1) The Bull market has been reaffirmed.

2) The secondary (bearish) reaction against the Bull market has been terminated. Thus, both the primary and secondary trends are now bullish.

Brief summary of all the developments prior to today's break-up:

1) Last confirmed closing highs made on 5/7/21.

2) From such highs, there was a 29 trading days pullback that qualified as a secondary reaction.

3) Off the 6/18/21 secondary reaction lows, a rally followed. Such a rally set up the US stock indexes for a potential bear market signal. If the 6/18/21 secondary reaction lows had been jointly broken down, a Bear market would have been signaled.

4) The DJI broke up above its last highs (5/7/21) on 7/2/21. The DJT did not confirm. Hence, we could not declare the end of the secondary reaction, and the Bull market was not reconfirmed.

5) The DJT broke down below its secondary reaction lows (6/18/21) unconfirmed by the DJI. Absent confirmation, no Bear market was signaled.

6) So we were in a "tie" situation. We had a break-up and a break-down unconfirmed. In such situations, the Dow Theory gives the benefit of doubt to the current trend (Bull market). So during all this period of hesitancy the trend was considered bullish.

7) Today, 2/11/21 by finally breaking topside its 5/7/21 highs, the DJT confirmed the DJI break-up, and the Bull market has been reconfirmed. End of the secondary reaction.


The Table below contains all the relevant data:


 And the charts below say it all:


The appraisal of the trend in this specific instance coincides with both the Dow Theory when one is not bound by the “three weeks” time requirements and the “purist” (misguided) interpretation that strictly demands at least three weeks for a secondary reaction to exist. More about two alternative way to assess the existence of secondary reaction here.


And what about the trend when appraised by the Dow Theory for the 21st Century (aka. Schannep’s Dow Theory)? As an appetizer, Schannep’s Dow Theory since 1953 outperformed Buy and Hold by 3.25% p.a. with a marked reduction of both the depth and time in drawdown. Schannep’s Dow Theory achieved such an outperformance by investing only in the major indexes, which is quite a feat. Furthermore, we went 100% invested on 4/6/2020 and have ridden the Bull to this date. On the other hand, the “original/classical” Dow Theory outperformed Buy and Hold by a modest 0.41% p.a., which is also OK given that drawdowns were also reduced. On a risked-adjusted basis, both Dow Theory “flavors” greatly outperformed Buy and Hold. Do you want to know more? Become a Subscriber, and you’ll get access to a wealth of information (i.e., access to our Letters since 1962 and their concomitant trade recommendations, the power of the consumer confidence report as a timing device, the special report about the yield curve, how to calculate profit objectives that work, and much more). More importantly, you’ll be punctually updated through our email service of any change of trends. Not accidentally, our Newsletter has consistently been ranked among the top investments Letters.

Sincerely,

Manuel Blay

Co-Editor of thedowtheory.com