Thursday, July 23, 2020

Dow Theory Update for July 23: Are we nearing a secondary reaction in precious metals?


Is the time to (partially) unload nigh?


Rhea, in his actual trading, tried to avoid as much as possible secondary reactions. He tried to unload near the end of a bull swing or at the very beginning of a secondary reaction with the hope (many times fulfilled) of replenishing his line at a lower price near to the bottom of the secondary reaction. 

To this end, Rhea devised several methods to “guestimate” the end of a primary bull swing. To do this, he paid attention, among many others, to volume, time, and, more importantly, divergence. Divergence is not the same as lack of confirmation. Divergence means that one index is going up whereas the other is going down. Countless times Rhea wrote that divergence tends to be a harbinger of strong moves. Either in the direction of the current trend, once the two indices get in sync again, or a counter move. Rhea also paid attention to public sentiment, news, etc. Lots of euphoria confirmed with technical action tended to increase the likelihood of a reversal

While not every trader has been cut out to trade like Rhea, as trading like Rhea is time-consuming and requires nerves of steel (hence my preference within the realm of stocks for Schannep’s Dow Theory which is the closest thing to stress-free trading), I have eyes to look at the charts and read the news.

I see too much bullishness in the air surrounding precious metals.

I also see on the charts that volume has exploded. Prices have indeed responded well by advancing nicely.

I also see today (July 23rd) that SLV closed lower, whereas GLD made a higher high. So this is divergence. One day of divergence does not necessarily entail the end of the current primary bull swing. However, it is a yellow light, especially when this divergence occurs at extremely overbought levels. 

I also see that the silver and gold ETF miners (SIL and GDX) have failed to make higher highs. Here we have down-side confirmation. Volume was insane during the last few days. 

So if I take into account that:

  • Volume has increased dramatically.
  • The news and general mood are too bullish (I even received whatapps congratulating me for my precious metals holdings).
  • We see a divergence in gold and silver and outright failure to make higher highs in SIL and GDX, leaving gold alone in making higher highs. 
  • The last primary bear market lows for gold were made on 11/08/2019, and the swing that started off the last secondary reaction lows of 3/19/2020 has been running on for more than four months.
  • A position taken in SIL on 4/9/2020 (see an explanation of why this was the sweet spot to buy for those fully understanding Rhea here) is currently yielding more than 60%. 


I feel some traders might consider either one of the following:


A. Partially lighten up some accounts (selling into strength) with the hope of rebuying at a lower price. 

B. Wait until there is a mini pullback (not qualifying as secondary reaction, it could be 1-2 days decline). Following the mini pullback, no higher highs are made, and after that, the mini pullback lows get jointly broken down. Upon the breakdown, sell to the sleeping point. 

C. Do nothing and ride the secondary reaction (if one finally sets in).

If your time is in short supply and/or lack the skills to emulate Rhea, you might feel comfortable with the option shown at “C”: Do nothing.

However, for those brave of heart, full of unrealized profits, and deep knowledge of how to appraise the end of a secondary reaction with the hope of rebuying at a lower level, options “B” or even “A” (for a smaller sum) or a mix of all the options might be considered. 

As this blog evolves, I become more and more convinced that there is no single “right” way of trading. All that I explain here is Dow Theory (who will contend that Rhea was no Dow Theorist?). Some “flavors” while showing more promise (performance and less drawdown) require more focus and knowledge, and do not lend themselves to fixed rules and back-testing (which may test your patience in real trading, pun intended). Other flavors may be less “flexible” but result in a more stress-free life. Eventually, it all depends on the personal circumstances of each trader. What works for some traders is unworkable for other traders. Hence, I feel that this blog rather than pontificate about “exact” buy and sell signals (which will be given nonetheless) should attempt to open the readers' minds about the different trading possibilities that may be derived from the Dow Theory. 


No charts are necessary. Just put your imagination to work


Sincerely,
One Dow Theorist

Tuesday, July 21, 2020

Dow Theory Update for July 21: US stocks and US interest rates remain in primary bull market


Today the focus of this post is US stock indexes and US interest rates.

As to precious metals, gold and silver, and their ETF miners continue making higher highs (at some point a secondary reaction will develop) and last week’s analysis remains unchanged.

I am writing before the close, so things might change. Readers beware. 


US STOCKS

Schannep’s Dow Theory (more properly: The Dow Theory for the 21st Century)


At 07/03/2020, the primary trend was bullish since April 6th, 2020, as was explained here.

The April 6th, 2020 Buy signal (caused by a Bull market definition) was not an easy one to act upon, as it was given at ca. 19% (for the S&P 500) off the bear market bottom. Fear that the market was already overextended and fear of a significant loss should the market decline revisiting the 03/23/2020 bear market lows resulted in some investors expressing concern. An in-depth study about the viability of the Buy signal of April 6th, 2020 is available in our June 1st, 2020 Letter to Subscribers of thedowtheory.com. Since many followers of this blog have become Subscribers, please read carefully the June 2020 Letter. For those still sitting on the sidelines, I encourage you to become Subscribers.

Subsequent price action is, once again proving that those fears were unwarranted. The current primary bull market signal is very likely to end up as a winning trade (barring a huge overnight gap down).

The secondary trend was declared bearish on 06/26/2020, as was explained here.


A setup for a primary bear market signal was completed on 06/30/2020. The details thereof can be found in the Subscribers area of thedowtheory.com


“Rhea’s /classical" Dow Theory

A) Market situation if one is to appraise secondary reactions not bound by the 3 weeks dogma.

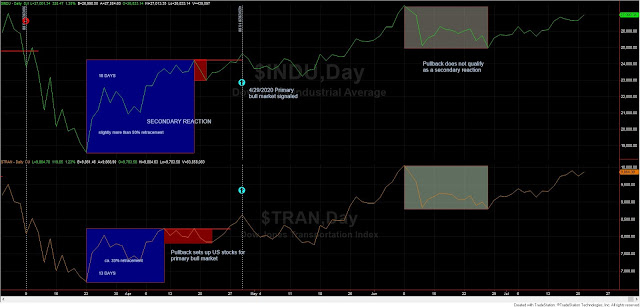
The primary trend is bullish since 4/29/2020 as explained here. This primary bull market signal was determined by just demanding 13 and 18 trading days for the appraisal of the secondary reaction that led to the primary bull market signal.
 
I recently wrote a “saga” (
here, here and here) where I made clear that neither the 15 days time requirement nor the 1/3 extent requirement is carved in stone. While most secondary reactions will last more than 15 days and retrace 1/3 of the previous swing, one should remain flexible, even under the “Rhea/classical” Dow Theory.

As of this writing, I see no secondary (bearish) reaction against the primary bull market. Off the 06/08/2020 primary bull market highs both indices have declined for 14 trading days until 6/26/2020. In this specific instance, and given that the decline has not reached extreme proportions (please mind that the Industrials are far from having retraced at least 1/3 of the bull swing that got started off the 03/23/2020 bear market lows), I am inclined to remain conservative and wait until I either see some more days of decline and/or a confirmed retracement of at least 1/3 in both indexes.


All in all, the primary and secondary trend is bullish.

Here you have an updated chart:

Grey rectangles display a pullback which I feel doesn't qualify as a secondary reaction

B) Market situation if one sticks to the traditional interpretation demanding more than three weeks of movement in order to declare a secondary reaction.


For those strictly demanding more than 15 confirmed days of declining prices, the primary bull market would have been signaled on 5/26/2020. More details as to this alternative signal are to be found in our June 1st, 2020 Letter to Subscribers.

Here you have an updated chart:


As of this writing, I see no secondary (bearish) reaction against the primary bull market. Off the 06/08/2020 primary bull market highs both indices have declined for 14 trading days which falls short of the more than three weeks time requirement.


All in all, the primary and secondary trend is bullish.

US INTEREST RATES

A) Market situation if one is to appraise secondary reactions not bound by the 3 weeks dogma.


If one appraised the secondary reaction that led to the setup that resulted in the primary bull market signal, the primary bull market was signaled on 11/19/2018. The signal of 11/19/2018 was obtained by being satisfied with just 14 trading days for TLT and 15 days for IEF.


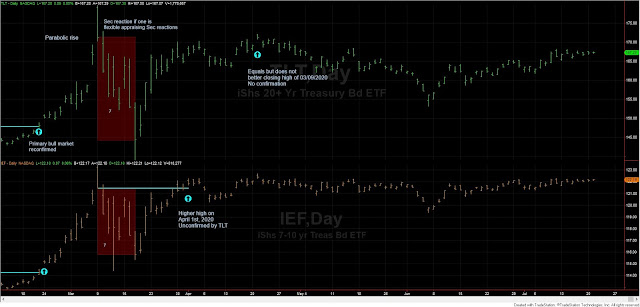
From the 03/09/2020 closing highs, both ETFs declined until a bottom was made on 3/18/2020. Hence, there has been just 7 days of decline, and, thus, the time requirement for a secondary reaction against the strong bullish trend has not been met. However, given the magnitude of the shake-up, retracement of the last bull market swing, and the total percentage of the declines, I’d be inclined to shorten the time requirement so that the 03/18/2020 closing lows become the lows of a secondary reaction of just 7 trading days.

On 04/01/202,0 IEF bettered its last primary bull market closing highs of 03/09/2020 unconfirmed by TLT. On 4/21/2020, TLT equaled its last recorded primary bull market high of 03/09/2020 but could not better it. One tenet of the Dow Theory is that we need penetration, just one decimal or cent suffices (Rhea debunked the notion that penetration had to be “decisive”). Hence, absent by a hair confirmation by TLT, the primary bull market has not been reconfirmed and, if we consider the last pullback as a secondary reaction, the secondary reaction has not been canceled, and the secondary trend remains bearish.

Here you have an updated chart. The red rectangles display the secondary reaction of just 7 days associated with big declines both in terms of retracement of the preceding bull market swing  (retracement of ca. 75% for TLT and ca. 50% for IEF) and the total percentage of the pullback (huge volatility, so a big movement percentage-wise). In my opinion, the charts are screaming at us “please shorten the time requirement for a secondary reaction; at least for half of your capital. Don’t ignore Rhea’s flexibility”. 


B) Market situation if one sticks to the traditional interpretation demanding more than three weeks of movement in order to declare a secondary reaction.


The signal of 12/18/2018 was obtained by being strict and demanding on a confirmed basis at least 15 trading days on both ETFs.

Since the pullback from 03/09/2020 to 03/18/2020 spanned just 7 trading days, and in spite of its huge magnitude, we cannot declare the existence of a secondary reaction if bound by the three weeks time requirement dogma. Subsequent declines have not managed to close below the 03/18/2020 closing lows and hence no secondary reaction has been signaled yet.


All in all: both the primary trend remains bullish, and the secondary trend continues bullish if we stick with a 3 weeks’ time requirement for a secondary reaction.

Here you have an updated chart:


Sincerely,
One Dow Theorist