Friday, August 26, 2022

Dow Theory Update for August 26: U.S. bonds under a secondary reaction against the primary bull market

I am posting before the close. So things might change after the close. So readers beware.

US INTEREST RATES

General Remarks:

In this post, I provided a thorough explanation concerning the rationale behind my use of two alternative definitions to appraise secondary reactions.

TLT is the iShares 20 years + Treasury bond ETF. More about it here

IEF is the iShares 7-10 years Treasury bond ETF. More about it here.

Thus, TLT tracks longer-term US bonds, whereas IEF tracks middle-term US bonds. A bull market in bonds entails lower interest rates. A bear market in bonds represents higher interest rates.

A) Market situation if one appraises secondary reactions not bound by the three weeks and 1/3 retracement dogma.

As I explained here, the primary trend was signaled as bullish on 7/22/22

Following the 8/01/22 closing highs, a deep pullback followed until 8/24/22. Such a pullback has lasted until now 17 trading days which amply meets the time requirement for a secondary reaction against the primary bull market. As for the extent requirement, it has been fulfilled too, given that TLT and IEF declined more than the Volatility-Adjusted Minimum Movement (more explanations about VAMM here).

The Table below contains all the details


Now we are waiting for a rally lasting at least two trading days and exceeding the VAMM on at least one ETF to set up both ETFs for a potential primary bear market signal.

Therefore, now we are confronted with three alternatives:


a) Either the 8/01/22 closing highs are jointly broken topside by TLT and IEF, which will re-affirm the primary bull market.


b) or the 6/14/22 last recorded primary bear market lows are broken downside, which will signal a new primary bear market. This signal is unlikely to materialize but is our last resort stop-loss in case that the awaited 2 days rally does not occur, and the bonds keep falling like a knife.


c) As explained above, we get a two days rally exceeding the VAMM on at least one ETF, which will set up TLT and IEF for a potential primary bear market signal.


In the meantime, we wait and observe. 


Below you have the updated charts. The brownish rectangles highlight the secondary reaction against the primary bull market.


B) Market situation if one sticks to the traditional interpretation demanding more than three weeks and 1/3 confirmed retracement to declare a secondary reaction.


The primary trend was signaled as bearish on 9/28/21. A more aggressive and legitimate interpretation would have signaled the bear market on 9/24/21. The explanations here.


The rally off the 6/14/22 closing lows lasted 32 trading days. Therefore, the time requirement for a secondary reaction has been met. As to the extent requirement, if we require 1/3 confirmed retracement of the previous bear swing, the retracement is around 25% for TLT and 41.5% for IEF. On the other hand, if we just require that the rally exceed the Volatility-Adjusted Minimum Movement (more explanations here), the extent requirement would have been met. While it’s up to each trader to make a judgment call, I consider the requirements for a secondary reaction fulfilled. The rally lasted 32 trading days, doubling the minimum time requirement of 15 days. Furthermore, percentage-wise the rally quadruples the VAMM for TLT and septuplicates the VAMM for IEF. Thus, I consider that the extent requirement is more than enough. This specific market juncture highlights that demanding at least a confirmed 1/3 retracement to consider the existence of a secondary reaction is flawed. I demolished such a myth in this post.

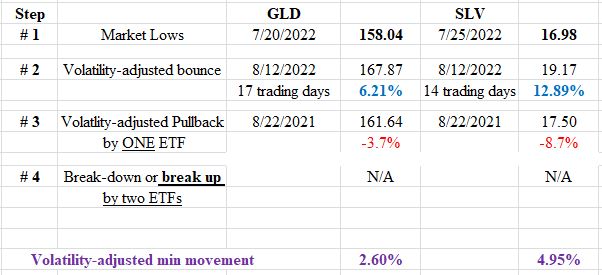
If we consider the rally ending on 8/1/22 as a secondary bullish reaction against the primary bear market, then the ensuing pullback has set up TLT and IEF for a potential primary bull market signal. The Table below contains all the relevant data:


So now the situation is as follows:

a) If the 8/1/22 closing highs are jointly broken up, a primary bull market will be signaled.

b) If the pullback continues lower and the 6/14/22 bear market closing lows are jointly broken down, the primary bear market would be re-affirmed.

The charts below display the price action from the Bull market top on 12/3/21 till the bear market last recorded lows on 6/14/22 and the rally (blue rectangles) that followed. The small grey rectangles in the middle of the charts show a rally that did not qualify as a secondary reaction, and, hence, according to the Dow Theory, is to be disregarded.


The charts below focus on the most recent price action, namely the most recent rally (secondary bullish reaction against the primary bear market, shown with a blue rectangle) and the most recent pullback that set up both ETFs for a potential primary bull market (shown with a brownish rectangle). The blue horizontal lines highlight the secondary reaction highs, the relevant levels to be broken topside for a new bull market to be signaled.


Sincerely,

Manuel Blay

Editor of thedowtheory.com


Thursday, August 25, 2022

Dow Theory Update for August 25: Setup for a primary bull market completed for GDX and SIL (precious metals miners’ ETFs)

I am posting before the close so things might change. Readers beware.

GOLD AND SILVER MINERS ETFs

 A) Market situation if one appraises secondary reactions not bound by the three weeks dogma.

As I explained here, the primary trend was signaled as bearish on 6/23/22.

Following the 7/25/22 closing lows for both GDX and for SIL, a strong rally followed until 8/10/22 (SIL) and 8/12/22 (GDX). Such a rally qualifies as a secondary reaction as the time and extent requirement for a secondary reaction has been met. GDX rallied for 14 trading days and SIL for 12 days. Percentage-wise, both ETFs amply exceeded the Volatility-Adjusted Minimum Movement (more explanations about VAMM here).

 After the 8/10/22 (SIL) and 8/12/22 (GDX) closing highs, a deep pullback ensued. Such a pullback (2 or more days) sets up both precious metals for a primary bull market signal. The extent requirement for the pullback has also been met as it exceeded in at least one index the VAMM. 

 The Table below contains all the details concerning the secondary reaction (rally) and the pullback that set up both ETFs for a potential primary bull market signal. 


Therefore, now we are confronted with two alternatives:


a) Either the 8/10/22 (SIL) and 8/12/22 (GDX) closing highs are jointly broken topside by GDX and SLV, which will signal a new primary bull market; 


b) or the 7/25/22 closings lows are broken jointly downside, which will reconfirm the primary bear market. 


In the meantime, we wait and observe. 

Below you have the updated charts. The blue rectangles highlight the secondary reaction against the primary bear market. The brownish rectangles show the pullback that set up GDX and SIL for a potential primary bull market signal. The blue horizontal lines highlight the secondary reaction closing highs, which are the relevant levels to be broken up. 


B) Market situation if one sticks to the traditional interpretation demanding at least three weeks of movement to declare a secondary reaction.

The primary trend was signaled as bearish on 8/9/2021, as was explained here

On 6/14/22, the primary bear market was re-affirmed (confirmed lower lows). Now both the primary and secondary trend is bearish.

The rally that started off the 7/25/22 closing lows did not reach at least 15 trading days on both ETFs, so we cannot talk of a secondary reaction. Therefore, the primary and secondary trends remain bearish. 

Sincerely,

Manuel Blay

Editor of thedowtheory.com


Wednesday, August 24, 2022

Dow Theory Update for August 24: Setup for a primary bull market completed for precious metals

Gold and Silver miners ETFs have also set up from a potential primary bull market signal

GOLD AND SILVER

A) Market situation if one appraises secondary reactions not bound by the three weeks dogma.


As I explained here, the primary and secondary trend was signaled as bearish on 6/30/22.


Following the 7/20/22 closing lows for GLD and 7/25/2022 for SLV, a strong rally followed until 8/12/22. Such a rally qualifies as a secondary reaction as the time and extent requirement for a secondary reaction has been met. GLD rallied for 17 trading days and SLV for 14 days. Percentage-wise, both ETFs amply exceeded the Volatility-Adjusted Minimum Movement (more explanations about VAMM here). 


After the 8/12/22 closing highs, a deep pullback ensued. Such a pullback (2 or more days) sets up both precious metals for a primary bull market signal. The extent requirement for the pullback has also been met as it exceeded in at least one index the VAMM. 


The Table below contains all the details concerning the secondary reaction (rally) and the pullback that set up both precious metals for a potential primary bull market signal.


Therefore, now we are confronted with two alternatives:


a) Either the 8/12/22 closing highs are jointly broken topside by GLD and SLV, which will signal a new primary bull market; 


b) or the 7/20 (GLD) and 7/25 (SLV) closings lows are broken downside, which will reconfirm the primary bear market. 


In the meantime, we wait and observe. 


Below you have the updated charts. The blue rectangles highlight the secondary reaction against the primary bear market. The brownish rectangles show the pullback that set up GLD and SLV for a potential primary bull market signal. The blue horizontal lines highlight the secondary reaction closing highs, which are the relevant levels to be broken up.


While not strictly Dow Theory, there is a decent probability for a nice rally in the weeks ahead. The decline from the last recorded high (3/8/22 for GLD & SLV) to the final bottom until 7/20/22 (GLD) and 7/25/22 (SLV) has been substantial and near Capitulation levels. You may surely know that, when it comes to stock indexes, we have a flawless Capitulation indicator that identifies many bear market bottoms. As for precious metals, I am toying with such a Capitulation indicator, but I am not finished yet. However, my preliminary studies show that the most recent drop in precious metals resulted quite often in the past in significant rallies. I don’t want to be more precise, as my Capitulation indicator for precious metals is not ready yet. 


B) Market situation if one sticks to the traditional interpretation demanding at least three weeks of movement to declare a secondary reaction.

As I explained here, the primary and secondary trend was signaled as bearish on 6/30/22.

The rally that started off the 7/20/22 closing lows for GLD and 7/25/2022 for SLV did not reach at least 15 trading days on both ETFs, so we cannot talk of a secondary reaction. Therefore, the primary and secondary trends remain bearish. 

Sincerely,

Manuel Blay

Editor of thedowtheory.com


Monday, August 15, 2022

Dow Theory Update for August 15: Update on the trend for U.S. bonds on Alessio Rastani YouTube channel

Famed Youtuber and successful trader Alessio Rastani and I have been discussing the current trend for U.S. bonds and its implications for the economy. Click on the link below to see the interview:

https://www.youtube.com/watch?v=ey0SPpb6BXk&t=2s

 And to see our past interview on gold:

https://www.youtube.com/watch?v=pG7j0aXlXx8&t=3s

I highly recommend Alessio’s channel. It is loaded with great, enjoyable, and actionable content.

Sincerely,

Manuel Blay

Editor of thedowtheory.com

Tuesday, August 9, 2022

Dow Theory Update for August 9: How to follow me on LinkedIn


Interview in Alessio Rastani's Youtube channel.


As usual, time is in short supply. So, while I keep this blog updated when trends change, I cannot post as often as I would like if I had more time available.


However, on LinkedIn, I post almost every day. Short posts, not the size you usually see on this blog, but valuable tidbits of information. I encourage you to visit the link below and click “follow.” LinkedIn is a great place to find helpful information. Unlike other social media, most people on Linkedin post meaningful content.


https://www.linkedin.com/in/manuel-blay/


By the way, I was recently invited to Alessio Rastani’s YouTube channel. We discussed the current situation for gold and silver. Alessio is a great market analyst, and I highly recommend his videos. If you can bear my Spanish accent, you can watch the video I have linked below:

https://www.youtube.com/watch?v=pG7j0aXlXx8

Sincerely,

Manuel Blay

Editor of thedowtheory.com