Update on the
trends for precious metals.
US INTEREST RATES
General Remarks:
In
this post, I provided a thorough
explanation concerning the rationale behind my use of two alternative
definitions to appraise secondary reactions.
TLT is the
iShares 20 years + Treasury bond ETF. More about it here
IEF is the
iShares 7-10 years Treasury bond ETF. More about it here.
Thus, TLT
tracks longer-term US bonds, whereas IEF tracks middle-term US bonds. A bull
market in bonds entails lower interest rates. A bear market in bonds represents
higher interest rates.
A) Market
situation if one appraises secondary reactions not bound by the three weeks and
1/3 retracement dogma.
The primary trend was
signaled as bearish on 1/5/22, as I explained here.
As I
explained here, the secondary trend was signaled as bullish (secondary
reaction) on 5/25/22.
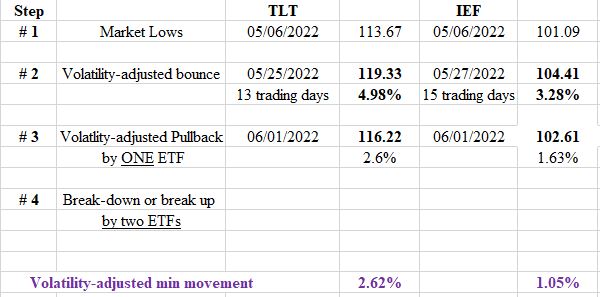
The last secondary reaction closing highs were made on
5/25/22 (TLT) and 5/27/22 (IEF) – Step #2 on the table below- . After those
highs, a pullback (Step #3) set up both ETFs for a primary bull market signal
on 6/1/22. Following that date, the pullback continued lower.
So now we have two options:
a) Either TLT and IEF break up above the secondary
reaction highs (Step #2), which would signal a primary bull market.
b) Or both TLT and IEF break down below the last
recorded primary bear market lows (Step #1), which would reconfirm the ongoing
bear market & cancel the current secondary reaction.
We sit and wait.
Below the updated charts. The purple rectangles
display the secondary reaction against the primary bear market. The brownish
rectangles show the current pullback that set up both ETFs for a primary bull
market signal. The darkest one highlights the date when the setup for a bull
market signal was first completed. The blue horizontal lines show the relevant
levels to be broken topside for a new bull market. The red ones show the price
levels to be breached for a reconfirmation of the bear market.
B) Market
situation if one sticks to the traditional interpretation demanding more than
three weeks and 1/3 confirmed retracement to declare a secondary reaction.
The primary
trend was signaled as bearish on 9/28/21. A more aggressive and legitimate
interpretation would have signaled the bear market on 9/24/21. The explanations
here.
In my 12/3/21 post, I wrote that the rallies that had until then
developed did not qualify as a secondary reaction. The situation has not changed,
as the current rally has not fulfilled the time requirement.
GOLD AND
SILVER
A) Market situation if one appraises secondary reactions not bound by
the three weeks dogma.
The primary trend was signaled as bullish on 11/11/21, as I explained here. Despite the current pullback, the trend remains
bullish.
The secondary trend is bearish (secondary reaction against the bullish
trend), and the setup for a primary bear market signal has been completed, as I
explained here.
Since that post, the technical situation has not changed. Below is the
updated table displaying the technical situation:
From
a Dow Theory perspective, there are three possible outcomes:
1) Either GLD and SLV jointly break up above their
last 3/8/22 bull market highs (Step #1), in which case the primary bull market
would be reconfirmed, and the secondary reaction terminated.
2) Or GLD and SLV jointly break down below their
secondary reaction lows (Step #2) which would signal a primary bear market.
3) Or GLD breaks down below the lows of the last
completed secondary reaction (12/2/21 @ 165.24), which would confirm SLV’s
breakdown and signal a primary bear market.
B) Market situation if one sticks to the
traditional interpretation demanding at least three weeks of movement to
declare a secondary reaction.
The primary trend was signaled as bullish on 3/1/22,
as was explained here.
Off the 3/8/22
closing highs, SLV declined until 5/12/22, and GLD fell until 5/13/22. The drop
amply exceeds the time (15 days) and extent requirement for a secondary
(bearish) reaction against the primary bull market. It also exceeds the
Volatility-Adjusted Minimum Movement (VAMM)
to qualify as a secondary reaction.
The Table below displays the price action since the
primary bull market highs:
On 5/10/22, SLV broke down below the 9/21/21 primary
bear market lows unconfirmed by GLD. Absent confirmation, no primary
bear market was signaled.
So now we have the following options:
1)
Either GLD and SLV jointly break up above their last 3/8/22 bull market highs
(Step #1), in which case the primary bull market would be reconfirmed and the
secondary reaction terminated.
2) Or GLD and SLV jointly break down below their
secondary reaction lows (Step #2) which would signal a primary bear market.
3) Or GLD breaks down below the lows of the last primary
bear market (9/29/21 @ 161.32), which would confirm SLV’s breakdown and signal
a primary bear market too.
The
charts below display the most recent price action. The brownish rectangles
highlight the secondary (bearish) reaction against the primary bull market. The
violet rectangles on the right side of the chart display the bounce that sets
up GLD and SLV for a primary bear market signal. The red horizontal lines
highlight the relevant price levels to be broken out for a bear signal to be
signaled. The blue horizontal lights show the last primary bull market highs which have to be jointly broken topside to cancel the current secondary reaction.
GOLD AND
SILVER MINERS ETFs
A) Market situation if one appraises secondary reactions not bound by
the three weeks dogma.
The primary trend was
signaled as bullish on 3/10/22, as I explained here. Despite the current pullback, the trend remains
bullish.
Please read my post of May 26th, 2022, for an accurate rendering of the current
situation (namely, secondary reaction and set up for a potential primary bear
market signal completed). Since that post, the technical situation has not
changed.
B) Market situation if one sticks to the
traditional interpretation demanding at least three weeks of movement to
declare a secondary reaction.
The primary
trend was signaled as bearish on 8/9/2021, as was explained here.
Starting at the 1/28/22
closing lows, SIL rallied until 4/13/22 @39.54. GDX rallied until 4/18/22
@40.87. Such a rally amply exceeded the time (15 trading days) and extent
requirement for a secondary reaction against the primary bear market. Following
such highs, the ensuing pullback set up both ETFs for a primary bull market
signal (>=2 days drop and Volatility-Adjusted Minimum Movement –VAMM-
exceeded).
The Table below contains
all the relevant data:
On 5/6/22, SIL broke down
below its 1/28/22 bear market closing lows unconfirmed by GDX. This
specific lack of confirmation has three consequences:
a) The primary bear market
has not been reconfirmed (which is slightly bullish).
b) The secondary reaction
(Step #2 on the Table) against the primary bear market has not been canceled.
c) The setup for a
potential primary bull market signal remains in force.
Please mind that on 3/1/22, GDX broke up above the
highs of the last completed secondary reaction (pink horizontal lines on the
charts below), unconfirmed by SIL. Thus, lacking confirmation, a primary
bull market was not signaled.
So now we have the following options:
1) SIL breaks up above the highs of the last completed
secondary reaction (the 11/12/21 highs, pink
horizontal line on the chart below), which would signal a primary bull market.
2) GDX and SIL break topside their secondary reaction
closing highs (Step #2, blue horizontal line on the charts below), which would
also signal a primary bull market.
3) GDX breaks down below its 1/28/22 closing lows (last
primary bear market lows), which would confirm SIL’s breakdown and cancel the
current secondary reaction and, with it, the setup for a primary bull market
signal.
The charts below display the current technical situation:
Overview: The spreadsheet below displays the primary trend in the pairs SLV/GLD
and SIL/GDX when we appraise them with either the "shorter-term" or
"longer-term" interpretation of the Dow Theory. The red color
displays a primary bear market, and the blue displays a primary bull market.
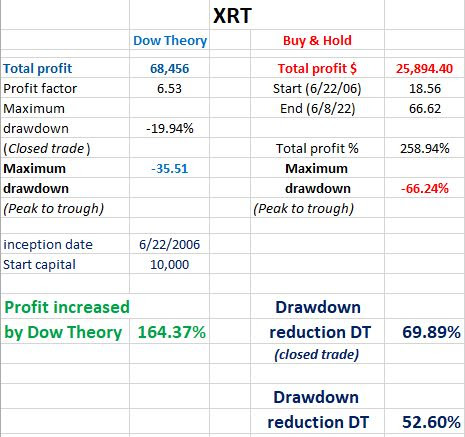
For those questioning whether all these charts actually work, I encourage them to read the following posts that prove with hard and fast data the marked drawdown reduction and outperformance achieved by the Dow Theory. For U.S. BONDS:
http://www.dowtheoryinvestment.com/2022/02/dow-theory-update-for-february-16-does.html
http://www.dowtheoryinvestment.com/2022/03/dow-theory-update-does-dow-theory-work.html
http://www.dowtheoryinvestment.com/2022/03/dow-theory-update-does-dow-theory-work_22.html
For Precious Metals and their ETF miners (GDX and SIL):
http://www.dowtheoryinvestment.com/p/dow-theorys-performance-when-applied-to.html
Sincerely,
Manuel Blay
Editor of
thedowtheory.com