Thursday, February 15, 2024

Unforeseen CPI Jump Rattles Markets: A Deep Dive into Gold and Silver and their New Bear market signaled on 2/13/24


Overview: On 2/13/24, January’s Consumer Price Index (CPI) exceeded expectations, triggering significant market upheaval. The Headline CPI saw a 0.3% month-over-month increase compared to the previous month’s 0.2% rise.

This unexpected development led to widespread turmoil:

  • Stocks plummeted.
  • Precious metals and their mining stocks declined.
  • U.S. treasuries experienced substantial drops amid concerns over higher inflation and the likelihood of delayed interest rate cuts.

While U.S. stock indexes are far from a bear market, the adverse news on February 13th, 2024, pushed precious metals and bonds into new bear market territory.

In my 2/6/24 post titled “Gold’s downturn? Dow Theory Signals Market Risks Ahead” I accurately alerted of a potential shift to a bearish trend in precious metals. As is often the case, price movements tend to precede news, so weakness was already evident before the bad CPI print.

The precious metals market is currently experiencing a significant bearish bias. The long-term assessment of the Dow Theory remains bearish, and SLV’s non-confirmation of GLD’s higher highs on December 27th, 2023, is a yellow flag (or even a reddish one). Furthermore, the short-term assessment of the Dow Theory (see below) shifted to bearish on February 13th, 2023, which adds more weight to the bearish case.

General Remarks:

In this post, I extensively elaborate on the rationale behind employing two alternative definitions to evaluate secondary reactions.

GLD refers to the SPDR® Gold Shares (NYSEArca: GLD®). More information about GLD can be found HERE.

SLV refers to the iShares Silver Trust (NYSEArca: SLV®). More information about SLV can be found HERE.

A) Market situation if one appraises secondary reactions not bound by the three weeks and 1/3 retracement dogma.  

As I explained in this post, the primary trend was signaled as bullish on 11/27/23.

Following a pullback (secondary reaction against the bullish trend), both TLT and IEF experienced a bounce, setting up both ETFs for a potential primary bear market. You can find detailed explanations and charts HERE.

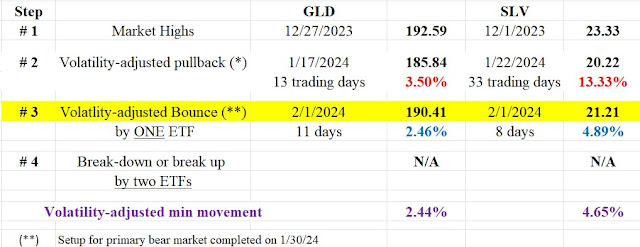
The table below furnishes relevant information:


On 2/13/24, GLD and SLV broke down below their 2/1/24 pullback lows (Step #2). Since it was a confirmed breakdown, a primary bear market was signaled according to the Dow Theory.

Check out the chart below for a visual walkthrough of the recent price action. The brown rectangles highlight the secondary reaction (Step #2), the blue rectangles showcase the rally (Step #3) originating from the secondary reaction lows that set up both ETFs for a potential bear market signal, and the red horizontal lines pinpoint the pullback lows whose joint violation signaled the new “bear market.” The blue horizontal lines highlight the last recorded primary bull market highs (Step #1), whose breakup would signal a new primary bull market.

Thus, both the primary and secondary trends are currently bearish.

B) Market situation if one sticks to the traditional interpretation demanding more than three weeks and 1/3 confirmed retracement to declare a secondary reaction.

As I explained HERE, the primary trend was signaled as bearish on 6/21/23.

Following the bear market lows on 10/5/23, there was a strong bounce until 12/1/23, which qualifies as a secondary reaction against the bear market given that both the time (at least 15 days confirmed) and extent requirements were met.

The extent requirement demands that both ETFs rally more than the Volatility-Adjusted Minimum Movement (VAMM). You can get more information about the VAMM HERE.

After the bounce highs (Step #2), a pullback ensued until 12/12/23. This pullback exceeding the VAMM and lasting >=2 days set up GLD and SLV for a potential primary bull market signal. If GLD and SLV jointly broke topside their 12/1/23 closing highs, a primary bull market would be signaled. On 12/27/23, GLD surpassed its 12/1/23 secondary reaction highs (Step #2), unconfirmed by SLV. One of the Dow Theory tenets is that we need confirmation for a signal to be given. In the absence of confirmation, no new primary bull market was signaled.

The table below shows the key dates and prices:

So, now we have the following options:

  1. Should SLV experience a rally and surpass its closing highs from December 1st, 2023, it would provide confirmation, signaling a new primary bull market. However, considering the absence of sudden price surges, this possibility seems improbable in the foreseeable days or weeks.
  2. Alternatively, if GLD and SLV continue to decline and breach their bear market lows from October 5th, 2023, three outcomes would arise:

a) The secondary reaction against the bear market would be canceled.

b) The setup for a potential primary bull market would be nullified, too.

c) The primary bear market would be confirmed.

Explore the chart below for a visual representation of recent price movements. The blue rectangles denote the secondary reaction (Step #2) originating from the October 5th, 2023, bear market lows (Step #1). The brown rectangles indicate the pullback (Step #3) after the latest market highs (Step #2). The secondary reaction highs (Step #2) are highlighted by blue horizontal lines, whose confirmed breach would signal a new primary bull market (currently highly improbable). Lastly, the red horizontal lines represent the October 5th, 2023, bear market lows (Step #1), whose confirmed penetration would reconfirm the ongoing bear market. 


Sincerely,

Manuel Blay

Editor of thedowtheory.com


Wednesday, February 14, 2024

Unforeseen CPI Jump Rattles Markets: A Deep Dive into U.S.Treasuries and their new Bear market signaled on 2/13/24

Stocks Plunge but bull market unchanged, and precious metals in a Bear market now: Market Reactions to CPI Surprise

Overview: Yesterday (2/13/24) morning’s Consumer Price Index (CPI) inflation report surpassed expectations, triggering significant market upheaval. The Headline CPI saw a 0.3% month-over-month increase compared to the previous month’s 0.2% rise. This unexpected development led to widespread turmoil: stocks plummeted, precious metals and their mining stocks declined, and U.S. treasuries experienced substantial drops amid concerns over higher inflation and the likelihood of delayed interest rate cuts.

In my post dated 2/2/24, titled “TLT and IEF Watch: Are Bonds on the Brink of a Primary Bear Market Signal?” I accurately predicted a potential shift to a bearish trend in bonds. As is often the case, price movements tend to precede news.

This post delves into the action of U.S. treasuries, as represented by the TLT and IEF ETFs. Unlike US stocks, the 2/13/24 drop ushered U.S. bonds into a new bear market. For the U.S. stock market, and notwithstanding the most recent drop, the primary and secondary trend is bullish. You can read the most recent Dow Theory trend appraisal for the U.S. stocks in my post “Critical Stock Market Update: The classical Dow Theory signaled a bull market on 2/8/24“. As an aside, the Dow Theory for the 21st Century signaled a BUY much earlier, capturing substantial gains along the way. You can read more about the net superiority of the DT21C vs. the Dow Theory in this article.

Stay tuned for another post, in which I will discuss the situation in the gold and silver markets, both of which also turned bearish on 2/13/24.

General Remarks:

In this post, I extensively elaborate on the rationale behind employing two alternative definitions to evaluate secondary reactions.

TLT refers to the iShares 20+ Year Treasury Bond ETF. You can find more information about it here

IEF refers to the iShares 7-10 Year Treasury Bond ETF. You can find more information about it here.

TLT tracks longer-term US bonds, while IEF tracks intermediate-term US bonds. A bull market in bonds signifies lower interest rates, whereas a bear market in bonds indicates higher interest rates.

A) Market situation if one appraises secondary reactions not bound by the three weeks and 1/3 retracement dogma. 

As I explained in this post, the primary trend was signaled as bullish on 12/13/23.

Following a pullback (secondary reaction against the bullish trend), both TLT and IEF experienced a bounce, setting up both ETFs for a potential primary bear market. You can find detailed explanations and charts here.

The table below furnishes relevant information:

On February 5th, 2024, IEF broke below its January 24th, 2024 closing lows (Step #2) without confirmation from TLT. However, on February 13th, 2024, TLT breached these lows, confirming the breakdown and thus signaling a new primary bear market according to the Dow Theory.

Check out the chart below for a visual walkthrough of the recent price action. The brown rectangles highlight the secondary reaction (Step #2), the blue rectangles showcase the rally (Step #3) originating from the secondary reaction lows that set up both ETFs for a potential bear market signal, and the red horizontal lines pinpoint the pullback lows whose joint violation signaled the new “bear market.” The blue horizontal lines highlight the last recorded primary bull market highs (Step #1) whose breakup would signal a new primary bull market.


Thus, both the primary and secondary trends are currently bearish.

B) Market situation if one sticks to the traditional interpretation demanding more than three weeks and 1/3 confirmed retracement to declare a secondary reaction.

As detailed in this post, the primary trend was signaled as bullish on 12/13/23.

In this specific instance, the price action explained above fully applies to the “longer-term” rendering of the Dow Theory. In other words, look at the table and charts above, as they fully explain what happened when we take a longer view. Therefore, the primary and the secondary trend are bearish.

Sincerely,

Manuel Blay

Editor of thedowtheory.com


Tuesday, February 13, 2024

Critical Stock Market Update: The classical Dow Theory signaled a bull market on 2/8/24


Reminder: The Dow Theory for the 21st Century provides even more precise timing for the stock market

I will explain the latest “classical” Dow Theory buy signal in this post.

I must state that I don’t trade this kind of Dow Theory, despite its good record of outperformance and drawdown reduction vs. Buy and Hold. Why? A much-improved version of the Dow Theory named the Dow Theory for the 21st Century (DT21C), was created two decades ago by Jack Schannep and delivers even greater outperformance and drawdown reduction. The DT21C has a record starting in 1953 and has been traded in real portfolios since its creation. So, we are talking of a real improvement over the original Dow Theory that has successfully been traded in the markets for many years. For example, the Dow Theory for the 21st Century signaled a BUY much earlier, capturing substantial gains along the way. You can read more about the net superiority of the DT21C vs. the Dow Theory in this article.

You can find the original Dow Theory record in these links and compare it with the DT21C record.

https://thedowtheory.com/resources/traditional-dow-theory/complete-dow-theory-record/

https://thedowtheory.com/indicators/dow-theory-for-the-21st-century/

That being said, keeping an eye on the classical Dow Theory is good. While inferior to the DT21C, it is still much better than most trend-following systems out there.

So, let’s examine the latest Dow Theory signal.

The primary trend turned bearish after the 8/1/23 and 7/28/23 top (Dow Industrials and Transportation, respectively). Following the 10/3/23 and 10/5/23 lows top (Dow Industrials and Transportation, respectively), there was a bounce until 1/2/24 and 12/19/23 (Dow Industrials and Transportation, respectively), thus lasting 44 trading days for the Industrials and 36 days for the Transportation. The pullback that set up both Indexes for a primary bear market signal lasted until 1/17/24. On 1/19/24, the Dow Industrials surpassed its 1/2/24 highs unconfirmed by the Transportation.

The Dow Theory is based on the principle of confirmation. As Robert Rhea put it, the movement of one index unconfirmed by the other is likely deceptive. Hence, if one index is trending up but the other is either going down or not going up enough to surpass previous highs, this lack of confirmation negates any new bull market.

Finally, on 2/8/24, the Dow Transportation broke above its 12/19/23 closing highs, confirming the Dow Industrials and triggering the new primary bull market signal.

However, Dow Theorist Rhea also wrote that belated confirmations carry less weight than earlier ones. So, I feel that this new bull market signal is a “weak” one and I would not be surprised to see weakness in the next two months.

Confirming technical weakness, the inflation report for January, published on 2/13/24, which exceeded expectations, caused a tumult in financial markets and disrupted investors’ predictions regarding the timing and magnitude of potential interest rate cuts by the Federal Reserve. The market was priced to perfection, and higher-for-longer interest rates may cause a painful correction in the stock market. However, we should not underestimate the power of the primary trend. Now, it is unambiguously bullish, so I don’t expect a bear market, but just a correction that may last a couple of months.

The table below give you all the relevant dates and prices:


Once in a bullish phase, our focus shifts to monitoring price levels that could indicate the start of a new primary bear market. At the time of writing, a joint penetration of the 10/27/23 market lows (Step #1 in the above Table) would change the primary trend from bullish to bearish. While this outcome seems unlikely at present, it warrants continuous observation. The more probable scenario is that following the current highs (or potential higher highs), a pullback will occur, with these pullback lows serving as the next stop-loss level. However, it’s important not to rush and exercise patience, allowing price action to guide us in determining the next stop-loss level.

The charts below depict the latest price movements. The upper chart illustrates the Dow Industrials, while the lower one represents the Dow Transportation. Highlighted by blue rectangles are the secondary reactions (bounces), while the red ones indicate pullbacks that positioned both indexes for a potential primary bull market signal. The blue horizontal lines mark the bounce highs (Step #2) of DJI and DJT, representing crucial price levels whose breach was necessary to signal a new primary bull market. The blue arrows indicate when DJI and DJT surpassed their respective bounce highs. Conversely, the red horizontal lines denote the most recent primary bear market lows, the breakdown of which would signal a primary bear market (an unlikely scenario at present).

Ever wondered about the effectiveness of the Dow Theory in the 21st century? It’s a powerful tool, and here’s the inside scoop: we’ve kept it exclusive to our subscribers. By staying ahead with the DT21C, they’ve been riding the bull market long before others caught on. But that’s not all. Subscribers also gain access to our Composite Indicator, a fusion of DT21C and the Blay Timing Indicator. Our model portfolio, guided by this Composite Indicator, defied naysayers in 2023 (and in 2020, December 2018, 2009, 2002, etc.), staying invested and delivering a remarkable profit of over +17%. If you’re serious about staying ahead in the market and minimizing your risks, it’s time to consider subscribing. Join us now and start maximizing your returns while reducing drawdowns. Take action and subscribe today!

https://thedowtheory.com/sign-up/

Sincerely,

Manuel Blay

Editor of thedowtheory.com


Tuesday, February 6, 2024

Dow Theory Update for February 6: Gold’s Downturn? Dow Theory Signals Market Risk Ahead

Setup for a potential primary bear market for GLD and SLV completed

Mark Hulbert, known for his keen market timing insights on MarketWatch, recently shared concerns about the longevity of the current gold bull market. It’s worth noting that excessive bullish sentiment can sometimes signal a bearish outlook. Check out his 2/5/23 article for more details. As I will explain in this  post Mark Hulbert may be onto something, as the setup for a potential primeary bear signal for GLD and SLV has been completed. In this post, we give you the relevant price levels to monitor whose violation would signal a new bear market.

General Remarks:

In this post, I thoroughly explained the rationale behind using two alternative definitions to appraise secondary reactions.

A) Market situation if one appraises secondary reactions not bound by the three weeks and 1/3 retracement dogma.  

As I explained in this post, the primary trend was signaled as bullish on 11/27/23.

Following their respective 12/1/23 (SLV) and 12/27/23 (GLD) highs (Step #1 in the Table below), the market experienced a pullback until 1/22/24 (SLV) and 1/17/24 (GLD)- Step #2. This pullback met the time and extent requirements for a secondary (bearish) reaction against the primary bullish trend. The subsequent rally, kickstarting from the Step #2 lows, gained enough extent by 1/30/24 to set up GLD and SLV for a potential primary bear market signal. This rally persisted until 2/1/24.

The Table below shows the details:


Therefore, the primary is bullish, and the secondary trend is bearish.

So, now we have the following scenarios:

a) If GLD and SLV jointly breach their respective 1/22/24 (SLV) and 1/17/24 (GLD) lows (Step #2), it would signify the onset of a primary bear market.

b) On the flip side, if GLD and SLV resume their recent rally (Step #3) and jointly surpass their 12/1/23 (GLD) and 12/27/23 (SLV) closing highs (Step #1), it would confirm the continuation of the primary bull market, rendering the secondary reaction null and void.

Take a look at the chart below to visually follow the recent price movements. The brown rectangles mark the secondary reaction (Step #2), while the blue rectangles illustrate the rally (Step #3) that began from the lows of the secondary reaction. The red horizontal lines indicate the pullback lows, the breach of which would signal a “bear market. The blue horizontal lines show the bull market highs  (Step #1) to be surpassed to reconfirm the primary bull market.


B) Market situation if one sticks to the traditional interpretation demanding more than three weeks and 1/3 confirmed retracement to declare a secondary reaction.

The secondary reaction against the primary bull market shown in the table above (Step #2) has not reached at least 15 trading days on both ETFs. Therefore, the extent requirement for a secondary reaction has not been met yet. Absent a secondary reaction, the most recent rally is irrelevant. To get a secondary reaction, which is the precondition for a subsequent setup, we need GLD closing below its 1/17/24 lows, in which case the total time below its 1/27/23 highs would be >=15 trading days. Until then, when we take the longer-term view of the Dow Theory, both the primary and secondary trends remain bullish.  

Sincerely,

Manuel Blay

Editor of thedowtheory.com

Friday, February 2, 2024

Dow Theory Update for February 2: TLT and IEF Watch: Are Bonds on the Brink of a Primary Bear Market Signal?

 Not yet, but the setup for a potential bear market signal in US bonds has been completed.

General Remarks:

In this post, I thoroughly explained the rationale behind using two alternative definitions to appraise secondary reactions.

TLT is the iShares 20 years + Treasury bond ETF. More about it here

IEF is the iShares 7-10 years Treasury bond ETF. More about it here.

Thus, TLT tracks longer-term US bonds, whereas IEF tracks middle-term US bonds. A bull market in bonds entails lower interest rates. A bear market in bonds represents higher interest rates.


A) Market situation if one appraises secondary reactions not bound by the three weeks and 1/3 retracement dogma. 

As I explained in this post, the primary trend was signaled as bullish on 12/13/23.

Following the 12/27/23 highs, the market experienced a pullback lasting 18 trading days, concluding on 1/24/24. This pullback met the time and extent requirements for a secondary (bearish) reaction against the primary bullish trend. The subsequent rally, kickstarting from the 1/24/24 lows, gained enough extent by 1/31/24 to set up TLT and IEF for a potential primary bear market signal. This rally persisted until 2/1/24, marking a crucial juncture.

The Table below shows the details:


Therefore, the primary is bullish and the secondary trend is bullish.

So, now we have the following scenarios:

a) If TLT and IEF jointly breach the 1/24/24 closing lows (refer to Step #2 in the table above), it would signify the onset of a primary bear market.

b) On the flip side, if TLT and IEF resume their recent rally and jointly surpass their 12/27/23 closing highs, it would confirm the continuation of the primary bull market, rendering the secondary reaction null and void.

Check out the chart below for a visual walkthrough of the recent price action. The brown rectangles highlight the secondary reaction (Step #2), the blue rectangles showcase the rally (Step #3) originating from the secondary reaction lows, and the red horizontal lines pinpoint the pullback lows whose joint violation would scream “bear market.”


As highlighted in previous discussions (HERE and HERE), the Dow Theory accurately tracked the now recently terminated bear market, shielding those who followed its cues from losses or even raking in profits for those who shorted.

B) Market situation if one sticks to the traditional interpretation demanding more than three weeks and 1/3 confirmed retracement to declare a secondary reaction.

As I explained in this post, the primary trend was signaled as bullish on 12/13/23.

In this specific instance, the price action that was explained above fully applies to the “longer-term” rendering of the Dow Theory. In other words, look at the table and charts above, as they fully explain what happened when we take a longer view. Therefore, the primary is bullish, and the secondary trend is bullish.

Sincerely,

Manuel Blay

Editor of thedowtheory.com