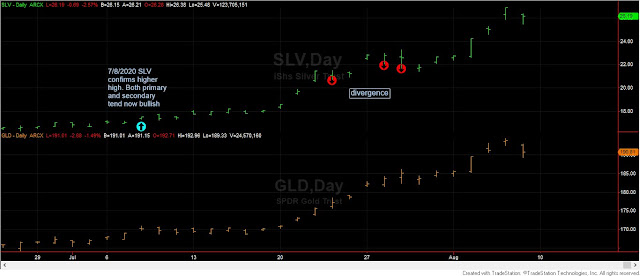
Primary and secondary trend for precious metals and their ETF miners remain bullish
General remarks
There is bullishness everywhere. US stocks, US bonds, and precious metals are all undergoing solid primary bull markets. Of course, trends can reverse. However, as of this writing, there are no secondary reactions in sight. It feels like a melt-up where everything is bought up (maybe caused by the decline of the US dollar?). While I don’t usually publicly write about the Euro and the Swiss Franc (they make a good pair so that we can analyze them under the Dow Theory), they seem to be in a nascent primary bull market.
When so much bullishness prevails, one should be extra attentive and not get too carried away by emotions (unrealized profits). Now everyone is bullish on gold and silver; even perma stocks bears are throwing in the towel and becoming bulls, as you can read in this Zero Hedge article, which should be a cause for concern (too much company on the long side).
By the way, the fact that such staunch bears are admitting defeat should give us pause. Opinions, even well-articulated ones from brilliant minds, can cost us dearly. This is why I remain at heart, a trend follower. We are not omniscient, and fundamental opinions may inadvertently lack one vital element. The lack of such a feature may result in the complete analysis being wrong, no matter how brilliant it looks.
In today’s post, I’ll focus on US stocks and US interest rates. However, please keep your eyes open on precious metals and their miners. As I explained here and here, we could be near the onset of a secondary reaction. Those trying to emulate Rhea (which implies lots of toil, as “no pain no gain”) and thus try to unload shortly before or at the onset of a secondary reaction, should closely monitor the breaking down of 08/11 and 08/12 closing lows on increasing volume. For those riding primary trends, barring an overnight gap, the primary trend is well entrenched.
Schannep’s Dow Theory (more properly: The Dow Theory for the 21st Century)
At 08/19/2020, the primary trend was bullish since April 6th, 2020, as was explained here.
The April 6th, 2020 Buy signal (caused by a Bull market definition) was not an easy one to act upon, as it was given at ca. 19% (for the S&P 500) off the bear market bottom. Fear that the market was already overextended and fear of a significant loss should the market decline revisiting the 03/23/2020 bear market lows resulted in some investors expressing concern. An in-depth study about the viability of the Buy signal of April 6th, 2020, is available in our June 1st, 2020 Letter to Subscribers of thedowtheory.com. Since many followers of this blog have become Subscribers, please read carefully the June 2020 Letter. For those still sitting on the sidelines, I encourage you to become Subscribers.
Subsequent price action is, once again, proving that those fears were unwarranted. The current primary bull market signal is very likely to end up as a winning trade (barring a huge overnight gap down). As with all bull markets, this one has to climb its own wall of fear.
The secondary trend was declared bearish on 06/26/2020, as was explained here.
On 7/20/2020, the S&P 500 bettered its 6/8/2020 primary bull market highs unconfirmed. On 8/4/2020 and 8/10/2020, the Transports and the Industrials confirmed, so the secondary reaction was canceled, and the primary bull market reconfirmed.
“Rhea’s /classical" Dow Theory
A) Market situation if one is to appraise secondary reactions not bound by the 3 weeks dogma.
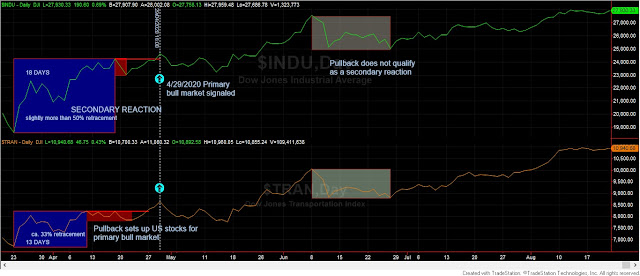
The primary trend is bullish since 4/29/2020, as explained here. This primary bull market signal was determined by just demanding 13 and 18 trading days to appraise the secondary reaction that led to the primary bull market signal.
I recently wrote a “saga” (here, here and here) where I made clear that neither the 15 days time requirement nor the 1/3 extent requirement is carved in stone. While most secondary reactions will last more than 15 days and retrace 1/3 of the previous swing, one should remain flexible, even under the “Rhea/classical” Dow Theory.
On 8/4/2020 and 8/10/2020, the Transports and the Industrials bettered their 6/8/2020 primary bull market highs and, thus, the primary bull market was confirmed. Please mind that no secondary reaction was canceled by the higher highs, as the decline did reach the necessary time and (more importantly) extent proportions to qualify as a secondary reaction (more details in this post)
Here you have an updated chart:
B) Market situation if one sticks to the traditional interpretation demanding more than three weeks of movement in order to declare a secondary reaction.
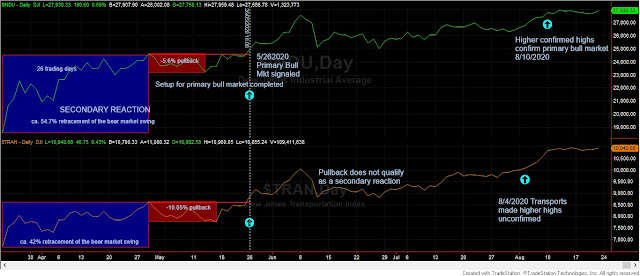
For those strictly demanding more than 15 confirmed days of declining prices, the primary bull market was signaled on 5/26/2020. More details about this alternative signal are to be found in our June 1st, 2020 Letter to Subscribers.
Following the 6/8/2020 highs, both the Industrials and Transports declined for several days. However, neither index exceeded 15 trading days of decline, so the time requirement for a secondary reaction was not met. So no secondary reaction was signaled.
On 8/4/2020 and 8/10/2020, the Transports and the Industrials bettered their 6/8/2020 primary bull market highs and, thus, the primary bull market was confirmed.
Here you have an updated chart:
US INTEREST RATES
General Remark:
TLT is the iShares 20 years + Treasury bond ETF. More about it here
IEF is the iShares 7-10 years Treasury bond ETF. More about it here.
Thus, TLT tracks longer term US bonds whereas TLT tracks middle term US bonds. A bull market in bonds entails lower interest rates. As you will read below the current situation for both the primary and secondary trend is bullish which implies that the trend for interest rates is down. In spite of some who say that bonds must go down because
inflation is coming, the primary bull market has been
reconfirmed (which suggests lower interest rates ahead)....We
follow the trend, and try not to argue with the markets.
A) Market situation if one is to appraise secondary reactions not bound by the 3 weeks dogma.
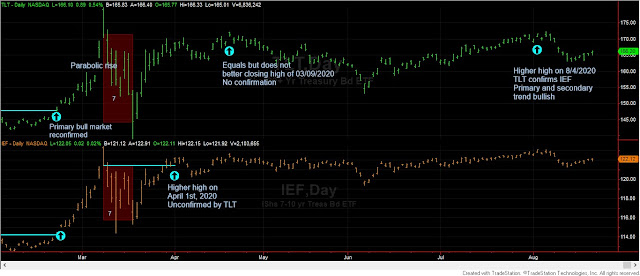
If one appraised the secondary reaction that led to the setup that resulted in the primary bull market signal, the primary bull market was signaled on 11/19/2018. The signal of 11/19/2018 was obtained by being satisfied with just 14 trading days for TLT and 15 days for IEF.
From the 03/09/2020 closing highs, both ETFs declined
until a bottom was made on 3/18/2020. Hence, there has been just seven days of
decline, and, thus, the time requirement for a secondary reaction against the
strong bullish trend has not been met. However, given the magnitude of the shake-up, retracement
of the last bull market swing, and the total percentage of the declines, I’d be inclined to shorten the time requirement so that the 03/18/2020
closing lows become the lows of a secondary reaction of just seven trading
days.
On 04/01/2020, IEF bettered its last primary bull market closing highs of 03/09/2020 unconfirmed by TLT. On 4/21/2020, TLT equaled its previous recorded primary bull market high of 03/09/2020 but could not better it. One tenet of the Dow Theory is that we need penetration, just one decimal or cent suffices (Rhea debunked the notion that penetration had to be “decisive”). On 08/04/2020 TLT finally deigned to confirm and broke up its 3/9/2020 primary bull market highs, and, hence, the primary bull market was reconfirmed, and the secondary reaction was put to an end. So now both the primary and secondary trend is bullish.
Here you have an updated chart. The orange rectangles display the secondary reaction of just seven days associated with significant declines both in terms of retracement of the preceding bull market and the subsequent breaking up of the primary bull market highs.
B) Market situation if one sticks to the traditional interpretation demanding more than three weeks of movement in order to declare a secondary reaction.
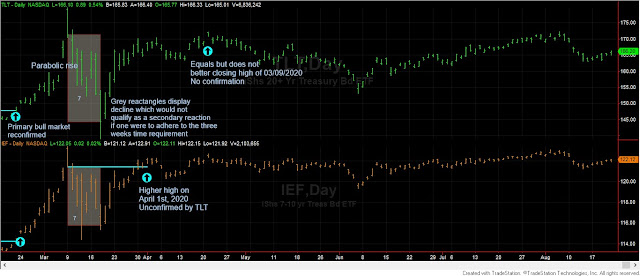
The signal of 12/18/2018 was obtained by being strict and demanding on a confirmed basis at least 15 trading days on both ETFs.
Since the pullback from 03/09/2020 to 03/18/2020 spanned just seven trading days, and despite its vast magnitude, we could not declare the existence of a secondary reaction if bound by the three weeks' time requirement dogma. Subsequent declines did not manage to close below the 03/18/2020 closing lows and hence no secondary reaction was signaled.
On 04/01/2020, IEF bettered its last primary bull market closing highs of 03/09/2020 unconfirmed by TLT. On 08/04/2020, TLT finally deigned to confirm and broke up its 3/9/2020 primary bull market highs, and, hence, the primary bull market was reconfirmed.
Here you have an updated chart:
Sincerely,
One Dow Theorist
