Friday, November 29, 2024

Bonds at crossroads: Set up for a potential bear market signal for TLT and IEF completed on 11/27/24

Dissecting the most recent price action for TLT & IEF. Key price levels to monitor

Overview: the most recent rally within an extended secondary (bearish) reaction has set up TLT and IEF for a potential primary bear market signal. The trend remains bullish to this day, but if the key prices I show in this post are jointly pierced, a new bearish trend will be signaled.

General Remarks:

In this post, I extensively elaborate on the rationale behind employing two alternative definitions to evaluate secondary reactions.

TLT refers to the iShares 20+ Year Treasury Bond ETF. You can find more information about it here

IEF refers to the iShares 7-10 Year Treasury Bond ETF. You can find more information about it here.

TLT tracks longer-term US bonds, while IEF tracks intermediate-term US bonds. A bull market in bonds signifies lower interest rates, whereas a bear market in bonds indicates higher interest rates.

A) Market situation if one appraises secondary reactions not bound by the three weeks and 1/3 retracement dogma 

As I explained in this post, the primary trend shifted to bullish on 6/4/24.

Following the 9/16/24 highs, there was a substantial pullback until 11/6/24 (TLT) and 11/15/24 (TLT). This pullback amply met the time and extent requirements for a secondary reaction.

On 11/13/24, TLT violated its 7/1/24 lows unconfirmed by IEF, so no primary bear market was signaled. Thus, the primary bull market remained intact. The 7/1/24 lows are the lows of the “last completed secondary reaction” (not the current one, but the one before that was successfully terminated by higher highs). The lows of the last completed secondary reaction also serve as relevant price levels to signal a trend change when we don’t have another option at a higher price level.

A rally ensued after the 11/13/24 (TLT) and 11/6/24 (IEF) lows. This rally also met the time and extent requirement to set up both ETFs for a potential primary bear market signal.

The table below gives you the relevant dates and prices:

So, now the situation is as follows:

1. A primary bear market will be signaled if TLT and IEF jointly pierce their 11/13/24 (TLT, at 89.8) and 11/6/24 (IEF, at 93.25) closing lows.

2. The primary bull market will be reconfirmed, and the setup for a potential bear market signal canceled, if TLT and IEF jointly surpass their 9/16/24 closing highs.

The following charts depict the latest price movements. Brown rectangles indicate the secondary (bearish) reaction opposing the ongoing primary bull market. Blue rectangles highlight the recent rally that fulfilled the setup for a potential primary bear market (Step #3). Red horizontal lines mark the secondary reaction lows (Step #2), while blue horizontal lines show the primary bull market peaks. A breach of these peaks would reaffirm the primary bull market, though this scenario appears unlikely in the near term.

Therefore, the primary trend is bullish, and the secondary trend is bearish.

B) Market situation if one sticks to the traditional interpretation demanding more than three weeks and 1/3 confirmed retracement to declare a secondary reaction.

As I explained in this post, the primary trend was signaled as bullish on 7/31/24.

The most recent pullback meets the time (>=15 trading days) and extent requirement for a secondary reaction. And the most recent rally, has also set up TLT and IEF for a potential primary bear market signal.

In this instance, the long-term application of the Dow Theory coincides with the shorter-term version, so there was a secondary reaction against the primary bull market and the most recent rally set up both ETFs for a potential primary bear market signal.

Sincerely,

Manuel Blay

Editor of thedowtheory.com


Friday, November 22, 2024

Gold and Silver at a Crossroads: Bull Continuation or Bear Market Ahead?


Breaking Down Gold and Silver: A Critical Moment

Overview: In a similar fashion to the gold and Silver miner’s ETFs, gold and silver reached a make-or-break moment on 20/19/24. The setup for a potential bear market has been completed, and the line on the sand has been drawn.

In this post, we examine the key prices to observe that would signal a new primary bear market.

General Remarks:

In this post, I extensively elaborate on the rationale behind employing two alternative definitions to evaluate secondary reactions.

GLD refers to the SPDR® Gold Shares (NYSEArca: GLD®). More information about GLD can be found HERE.

SLV refers to the iShares SLVver Trust (NYSEArca: SLV®). More information about SLV can be found HERE

A) Market situation if one appraises secondary reactions not bound by the three weeks and 1/3 retracement dogma.  

As I explained in this post, the primary trend was signaled as bullish on 4/3/24.

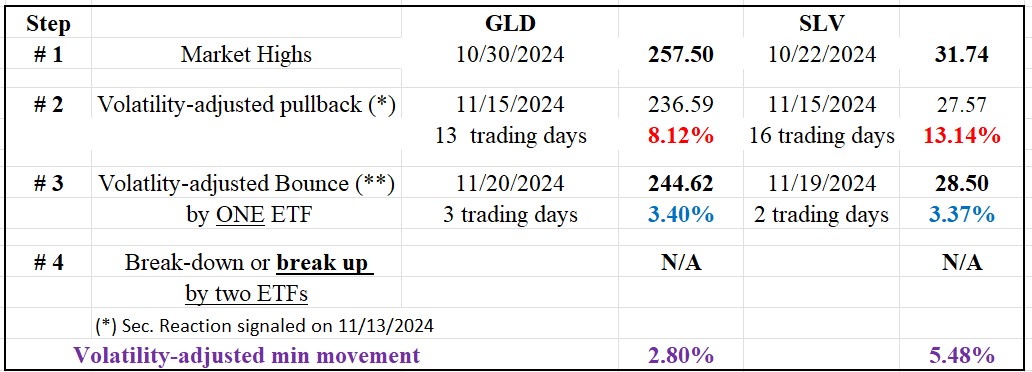
Following the 10/22/24 (SLV) and 10/30/24 (GLD) highs, there was a pullback until 11/15/24. Such a pullback meets the time and extent requirement for a secondary (bearish) reaction against the still-existing primary bull market.

The rally that started off the 11/15/24 lows until 11/19/24 (SLV) and 11/20/24 (GLD) set up both ETFs for a potential primary bear market signal. Thus, a confirmed breakdown of the 11/15/24 (SLV at 27.57 and GLD at 236.59) would signal a new primary bear market.

Please remember that we don’t require confirmation for the final rally that completes a bear (or bull) signal setup. More information is in this post.

The table below gives you the most relevant information:

250 gld slv dow theory short term table nov 20 2024 bis

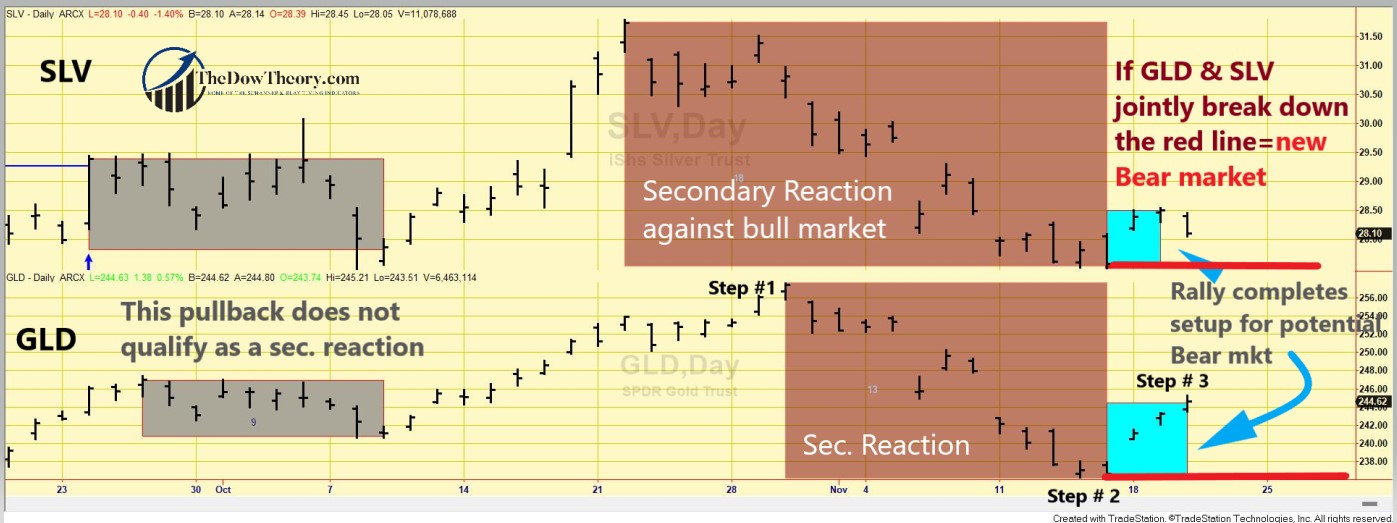
The chart below illustrates the latest price movements. The brown rectangles mark the secondary reaction against the primary bull market (Step #2). The blue rectangles indicate the rally (Step #3), positioning GLD and SLV for a potential bear market signal. The red horizontal lines show the secondary reaction lows (Step #2), where a confirmed break would signal a new primary bear market. The grey rectangles display a minor pullback that did not qualify as a secondary reaction.

 251 gld slv dow theory short term chart nov 20 2024 EDITED

 So, now we have two options:

  1. If GLD and SLV jointly break down their 11/15/24 (SLV at 27.57) and 11/15/24 (GLD at 236.59) lows, a new primary bear market would be signaled.
  2. If GLD and SLV jointly surpass their 10/22/24 (SLV) and 10/30/24 (GLD) highs, the primary bull market would be reconfirmed, and the secondary reaction and bearish setup would be canceled.

So, now, the primary trend is bullish, and the secondary one is bearish.

B) Market situation if one sticks to the traditional interpretation demanding more than three weeks and 1/3 confirmed retracement to declare a secondary reaction.

I explained in this post that the primary trend was signaled as bullish on 4/2/24.

The current pullback did not reach 15 confirmed days by both ETFs, so there is no secondary reaction against the bull market.

So, the primary and secondary trends are bullish under the “slower” appraisal of the Dow Theory.

Sincerely,

Manuel Blay

Editor of thedowtheory.com
 

Thursday, November 21, 2024

When Trends Speak Louder Than Data: Why Trend Following Wins Against Macro Investing

 AI’s Verdict: Trend Following Trumps Macro in the Investment Arena

I often receive emails highlighting macroeconomic data that supposedly contradicts or challenges the signals provided by price action—or trend-following—in markets like stocks, crypto, bonds, etc. These messages can give the impression that trend-following alone isn’t enough to keep us on the right side of the market, or worse, that the latest piece of fundamental information might derail the message given by price action.

While I do monitor certain fundamental variables that could hint at a potential trend shift, I want to stress a core principle: price action always comes first. If something is trending upward, it’s usually better to follow the trend rather than overanalyze or second-guess.

If fundamentals seem to clash with an uptrend, it’s a signal to manage risk more carefully—tightening stops or selling fully instead of partially if a breakdown occurs. However, avoiding buying or selling prematurely just because of a concerning macro factor can often lead to missed opportunities. Let the price guide your decisions.

Undoubtedly, intelligent authors pen these dense macro reports, but their track records often fall short of expectations. These fundamental reports can be so convincing that I would frequently take the bait if I weren’t a staunch trend follower.

While I’ve always known that trend-following strategies have historically outperformed those based on fundamental analysis—no matter how compelling macro predictions may seem—I wanted to get an objective perspective. To do so, I turned to AI Perplexity and asked the following question:

“There are several approaches to investing. One is ‘macro,’ which focuses on economic variables like unemployment, interest rates, GDP, etc. Macro investors try to forecast future market prices and profit from them by analyzing economic variables. On the other hand, there are trend followers who only focus on price action and disregard the economic data. Please check existing funds and hedge funds based on these two approaches and tell me which has historically had better performance and less drawdown.”

The response I received was enlightening and supported my inclination towards trend following. Here’s a summary of the key points:

[Start of AI quote]

Both global macro and trend following strategies have played significant roles in the hedge fund industry, each with its own strengths and historical performance characteristics. Global macro hedge funds analyze worldwide macroeconomic trends to identify investment opportunities across global markets, employing directional, relative value, and opportunistic trades. Notable global macro funds include AQR, Bridgewater, Citadel, and D.E. Shaw, among others. Trend following strategies, often categorized under Managed Futures or CTAs (Commodity Trading Advisors), focus on price movements rather than fundamental economic data. These strategies aim to capture medium-term price trends across various asset classes. Prominent trend following hedge funds include Winton Trend Fund, AQR, Man AHL, and Systematica. When comparing the two approaches, the AI’s analysis revealed several key advantages of trend following strategies:

  1. Long-term performance: Trend following strategies have shown to perform as well as equities in the long term, but with lower risk and smaller drawdowns. The Eurekahedge Trend Following Index demonstrates positive annual returns in most years since 2000, with particularly strong performances during market crises.
  2. Drawdown profile: Trend following strategies generally exhibit a more favorable drawdown profile compared to macro funds and equity markets. Maximum drawdowns for trend following strategies tend to be around 1.5 times their annualized volatility, compared to almost 3.5 times for equities.
  3. Crisis performance: Trend following strategies have shown exceptional performance during market crises. For example, during the 2008 financial crisis, when the S&P 500 experienced a 51% drawdown, trend following strategies gained 16.74%.
  4. Consistent profitability: A study examining trend following performance from 1880 to 2016 found that the strategy has been consistently profitable throughout this 137-year period.

While both strategies offer diversification benefits to traditional portfolios, trend following has shown particularly strong performance during equity market crises. A 50/50 combination of trend following and equity markets has been shown to increase the Sharpe ratio for equity markets by 66% and reduce the maximum drawdown from 51% to 22%. Based on this analysis, trend following strategies appear to have better average performance and less drawdown compared to macro funds. They have demonstrated more consistent positive returns over long periods, shallower drawdowns, better performance during market crises, and strong recent performance. “

[end of AI quote]

I downloaded and plotted the Eurekahege Trend Following Index performance data against the Macro Index from December 1999 to October 2024. Both Indexes are based on an equally weighted index of many funds that invest in stocks, futures, commodities, interest rates, etc.

The chart shows that trend-following beats macro:


The trend-following index delivers an average annual return of 8.83%, outperforming the macro index’s 7.71%. Notably, our trend-following indicator, The Dow Theory for the 21st Century (DT21C) has performed even better than both, as demonstrated HERE. This is particularly impressive given that our model performance was obtained by relying solely on the Dow Industrials and operates only on long positions. In contrast, the trend-following and macro indices utilize long/short strategies across a wide range of markets. The DT21C’s outperformance highlights the precision and effectiveness of our highly refined trend-following methodology. .

While this is not an indictment against macro, the takeaway is clear: An information overload need not necessarily translate into more performance. I want to spend my time becoming a better trend follower and, notably, creating good trend-following portfolios that are better than the sum of their parts rather than breaking my head trying to figure out which economic variable will influence the stock market’s next move.

This information reinforces my commitment to trend following as a primary investment strategy. While macro analysis can provide valuable insights, the historical evidence suggests that following price action and trends has been more reliable and profitable. As always, it’s important to remember that past performance does not guarantee future results, and the effectiveness of these strategies can vary depending on market conditions and implementation. However, the data strongly supports the notion that price action indeed trumps everything when it comes to investing.

Sincerely,

Manuel Blay

Editor of thedowtheory.com


Wednesday, November 20, 2024

Precious Metals Miners at a Crossroads: Bull Continuation or Bear Market Ahead?


Breaking Down the Gold and Silver Miners ETF: A Critical Moment

Overview: The gold and silver miners ETF reached a make-or-break moment on 11/19/24. The setup for a potential bear market has been completed, and the line on the sand has been drawn.

While gold and silver themselves have not yet completed the setup for a primary bear market, a continuation of the recent rally could soon lead to such a scenario.

General Remarks:

In this post, I extensively elaborate on the rationale behind employing two alternative definitions to evaluate secondary reactions.

SIL refers to the Silver Miners ETF. More information about SIL can be found HERE.

GDX refers to the Gold Miners ETF. More information about GDX can be found HERE.

A) Market situation if one appraises secondary reactions not bound by the three weeks and 1/3 retracement dogma.  

As I explained in this post, the primary trend was signaled as bullish on 4/3/24.

Following the 10/29/24 (SIL) and 10/22/24 (GDX) highs, there has been a pullback until 11/13/24 (SIL) and 11/15/24 (GDX). Such a pullback meets the time and extent requirement for a secondary (bearish) reaction against the still-existing primary bull market.

The rally that started off the 11/13/24 (SIL) and 11/15/24 (GDX) lows until 11/19/24 both ETFs for a potential primary bear market signal. Thus, a confirmed breakdown of the 11/13/24 (SIL at 34.60) and 11/15/24 (GDX at 35.51) would signal a new primary bear market.

Please remember that we don’t require confirmation for the final rally that completes a bear (or bull) signal setup. More information is in this post.

The table below gives you the most relevant information:

 The chart below illustrates the latest price movements. The brown rectangles mark the secondary reaction against the primary bull market (Step #2). The blue rectangles indicate the rally (Step #3), positioning GDX and SIL for a potential bear market signal. The red horizontal lines show the secondary reaction lows (Step #2), where a confirmed break would signal a new primary bear market. The grey rectangles display a minor pullback that did not qualify as a secondary reaction.

So, now we have two options:

1. If GDX and SIL jointly break down their 11/13/24 (SIL at 34.60) and 11/15/24 (GDX at 35.51) lows, a new primary bear market would be signaled.

2. If GDX and SIL jointly surpass their 10/29/24 (SIL) and 10/22/24 (GDX) highs, the primary bull market would be reconfirmed, and the secondary reaction and bearish setup would be canceled.

So, now, the primary trend is bullish, and the secondary one is bearish.

B) Market situation if one sticks to the traditional interpretation demanding more than three weeks and 1/3 confirmed retracement to declare a secondary reaction.

I explained in this post that the primary trend was signaled as bullish on 4/2/24.

The current pullback did not reach 15 confirmed days by both ETFs, so there is no secondary reaction against the bull market.

So, the primary and secondary trends are bullish under the “slower” appraisal of the Dow Theory.

Sincerely,

Manuel Blay

Editor of thedowtheory.com


Tuesday, November 19, 2024

Bullish again: Bull market signal for Bitcoin and Ethereum triggered on 11/7/24


It took a while for Ethereum to confirm Bitcoin, but it happened at last.

Let’s recap the technical landscape for Bitcoin.

Bitcoin and Ethereum made their last bear market lows on 8/5/24. A rally followed such lows until 8/23/24 (Ethereum) and 8/26/24 (Bitcoin). Such a rally qualified as a secondary reaction against the bearish trend.

Both BTC and ETHE experienced a pullback until 9/6/24. The pullback, which lasted more than two days, had enough extent to set both cryptocurrencies up for a potential primary bull market.

On 9/24/24, BTC surpassed its 8/26/24 secondary reaction highs, but ETHE did not confirm. Absent confirmation from ETHE, no new bull market was signaled.

The awaited confirmation was given by ETHE when, on 11/7/24, it finally broke up its 8/23/24 secondary reaction highs, and according to the Dow Theory, a new bull market has been signaled.

The charts below highlight the most recent price action that led to the new bull market signal. The blue rectangles showcase the secondary (bullish) reaction against the then-existing bear market. The brown rectangles highlight the pullback that set up both cryptocurrencies for a potential bull market signal. The blue horizontal lines highlight the secondary reaction highs, which were the relevant price levels to be jointly surpassed for a new bull market.


 So, the primary and secondary trends are now bullish.

As I write this post (11/14/24), Bitcoin is overbought, and I would not be surprised to see it receding from its current lofty levels to take a breather before resuming its ascent to higher highs. You may observe a huge gap in the chart, which I highlighted with a red oval. Gaps tend to get filled, so it would be normal price action if Bitcoin and Ethereum recede to fill the gap.

The Dow Theory nailed the bear market that started in mid-March 2024, and now it is back to bullish. Dow Theory signals don’t come around every day. When they do, smart money sits up and takes notice. Why? Because this isn’t just another fleeting market indicator. The Dow Theory boasts an impressive track record across diverse markets, making it the Swiss Army knife of financial forecasting, and it is much more accurate than other trend-following indicators such as moving averages. I provided the evidence HERE, HERE.

Sincerely,

Manuel Blay

Editor of thedowtheory.com