Monday, July 22, 2024

Will Small Caps Continue Outperforming Large Caps?


Understanding Small Cap Stocks in the Current Market

Will small caps continue outperforming large caps for a considerable time? Or have we just seen a flash in the pan? This is a question on many investors’ minds. While recent trends might suggest a resurgence of small-cap stocks, as shown by the chart below, the broader market dynamics hint at a different story.


I am convinced we are heading into a “winner-takes-all” economy, as Mark Hulbert (WSJ) has been suggesting since 2017.

Globalization and technology have created favorable conditions for mega companies like Apple, Amazon, and Facebook. These behemoths are leveraging their scale and technological advancements to dominate markets worldwide.

Even if globalization somehow unwinds, technology will continue to offer an advantage to tech-dominated global companies. The rapid pace of technological innovation ensures that large-cap companies with substantial resources can stay ahead of the curve, continuously improving efficiency and market reach.

Furthermore, the regulatory environment, which places undue compliance burdens on companies, clearly favors the big guy over the small guy. Large companies have the resources to navigate complex regulations, whereas smaller companies often struggle to keep up. So, I would not be surprised to see large-cap stocks outperforming their small peers for a long time. I am not saying that all small caps are doomed, but many will suffer.

The U.S. Advantage in the Global Economy

In the same vein as large companies, the USA is the country best placed to profit from the new normal. In fact, it has been taking the lead since at least 2009, as attested by the U.S. stock market performance vs its European peers. The U.S. has consistently shown resilience and earnings growth for shareholders, driven by its robust economic policies, innovation, and global influence.

I follow stock trends, but even more vital is to follow countries’ trends. Monitoring the economic health and policies of different countries can provide valuable insights into market movements and investment opportunities.

Key Takeaways for Investors

  1. U.S. Market Attractiveness: Despite its challenges, the USA remains one of the most attractive destinations for capital. It is the “less dirty shirt in the laundry basket” by a long shot. I don’t buy into the thesis that Europe or Emerging markets are cheap. They are cheap for good reason: They lack earnings and have dire perspectives unless they dramatically change their economic policies.
  2. U.S. Stock Indexes and Trend Following: Given that many U.S. (and world) companies are having and are likely to have a hard time in the future, stock indexes coupled with trend following to protect against the downside is my undisputable bet. What kind of trend following? Many trend-following systems are suboptimal and don’t stand scrutiny. The trend-following system must provide you with a track record spanning at least +20 years and have survived several bear markets. My trend-following systems boast a record starting as far back as 1953, so we can trade them with confidence.
  1. Challenges in Stock Picking: If the future is probably going to be unkind to most stocks, most stock-pickers will suffer. What worked in the past (buy a diversified portfolio, hold it for a long time, and reap the reward) will no longer work. But don’t worry, as the saying goes, “there is always a bar full of people.” We can adjust our stock-picking strategy to meet the new normal. More on this in a future post.

For more insights into market trends and investment strategies, you can explore the detailed indicators and analysis available at The Dow Theory.

By focusing on these key areas, investors can better navigate the complex and evolving financial landscape, ensuring their portfolios are well-positioned for long-term success. The happy years of buy and hold are over.

Sincerely,

Manuel Blay

Editor of thedowtheory.com


Wednesday, July 17, 2024

Gold and Silver ETF miners (GDX & SIL) soar: Primary bull market re-confirmed on 7/16/2024


Gold and Silver are also in a bull market

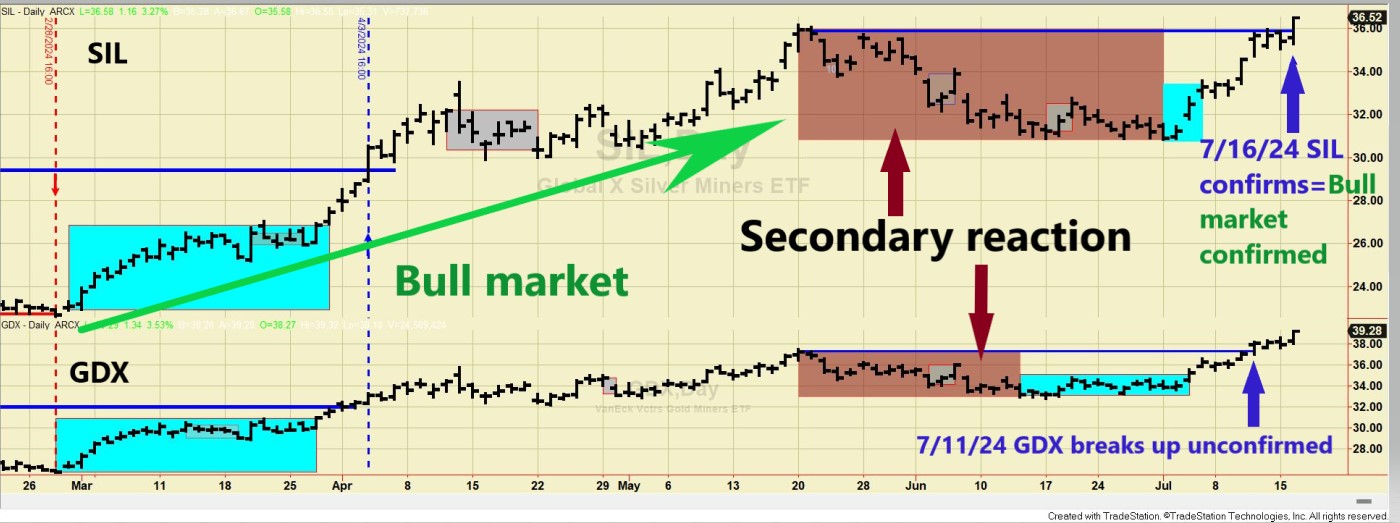
Overview: GDX and Sil underwent a secondary reaction against the primary bull market. Confirmed higher highs by both ETFs have reconfirmed the primary bull market.

Gold and Silver are in a bull market of their own, as I explained HERE.

I see most assets going to the roof. Are savvy speculators sensing that a wave of liquidity is going to be unleashed soon?

General Remarks:

In this post, I extensively elaborate on the rationale behind employing two alternative definitions to evaluate secondary reactions.

GLD refers to the SPDR® Gold Shares (NYSEArca: GLD®). More information about GLD can be found HERE.

SLV refers to the iShares Silver Trust (NYSEArca: SLV®). More information about SLV can be found HERE.

A) Market situation if one appraises secondary reactions not bound by the three weeks and 1/3 retracement dogma.  

As I explained in this post, the primary trend was signaled as bullish on 4/3/24. Following the 5/20/24 highs, both ETFs dropped until 6/13/24 (GDX @33.15) and 7/1/24 (SIL @30.9). Such a drop qualified as a secondary reaction against the bullish trend.

Following such lows, a strong rally ensued. On 7/11/24, GDX broke above its 5/20/24 closing highs (@37.24). On 7/16/24, SIL confirmed by surpassing its 5/20/24 closing highs @35.93.

So, the confirmed breakup above the last recorded primary bull market highs implies that the secondary reaction against the bull market has been canceled, and the primary bull market has been reconfirmed.

The charts below illustrate recent price movements. The brown rectangles highlight the secondary reaction within the primary bear market. The small blue rectangles on the right show the initial days of a rally that set up both ETFs for a potential primary bear market signal, which ultimately did not occur. The blue horizontal lines indicate the last recorded primary bull market highs that needed to be surpassed to reconfirm the bull market. 

213 GDX and SIL bull market recofirmed July 16 EDITED

Therefore, the primary and secondary trends are now bullish.

B) Market situation if one sticks to the traditional interpretation demanding more than three weeks and 1/3 confirmed retracement to declare a secondary reaction.

In this post, I explained that the primary trend was signaled as bullish on 4/3/24.

In this instance, the long-term application of the Dow Theory coincides with the shorter-term version, so there was a secondary reaction against the primary bull market that has been successfully terminated by confirmed higher highs.

Therefore, the primary and secondary trends are now bullish.

Sincerely,

Manuel Blay

Editor of thedowtheory.com
 

Tuesday, July 16, 2024

Bonds at crossroads: Contradictory setups completed imply the trend is now unclear

 Once hesitation is over, the next move can be explosive.


Overview: The bond market is really at a crossroads. Depending on the timeframe applied, we got two contradictory potential signals. The shorter-term application of the Dow Theory, which I favor in cases like this as it is more reactive, completed the setup for a potential bear market, while the long-term one resulted in just the opposite: a setup for a potential bull market.

Such a gross divergence between the two timeframes is infrequent. When it occurs, it shows a market lacking direction. When the bond market finally makes its mind up, the final move can be explosive.

Fundamentally, the bond market is caught between two contradictory forces: deflation and a likely recession and the underlying inflationary pressures, which, notwithstanding the most rcent CPI print, have not subsided yet, as evidenced by a rising Producer Price Index.

So, let’s get started with the Dow Theory analysis.

General Remarks:

In this post, I extensively elaborate on the rationale behind employing two alternative definitions to evaluate secondary reactions.

TLT refers to the iShares 20+ Year Treasury Bond ETF. You can find more information about it here

IEF refers to the iShares 7-10 Year Treasury Bond ETF. You can find more information about it here.

TLT tracks longer-term US bonds, while IEF tracks intermediate-term US bonds. A bull market in bonds signifies lower interest rates, whereas a bear market in bonds indicates higher interest rates.

A) Market situation if one appraises secondary reactions not bound by the three weeks and 1/3 retracement dogma 

As I explained in this post, the primary trend shifted to bullish on 6/4/24.

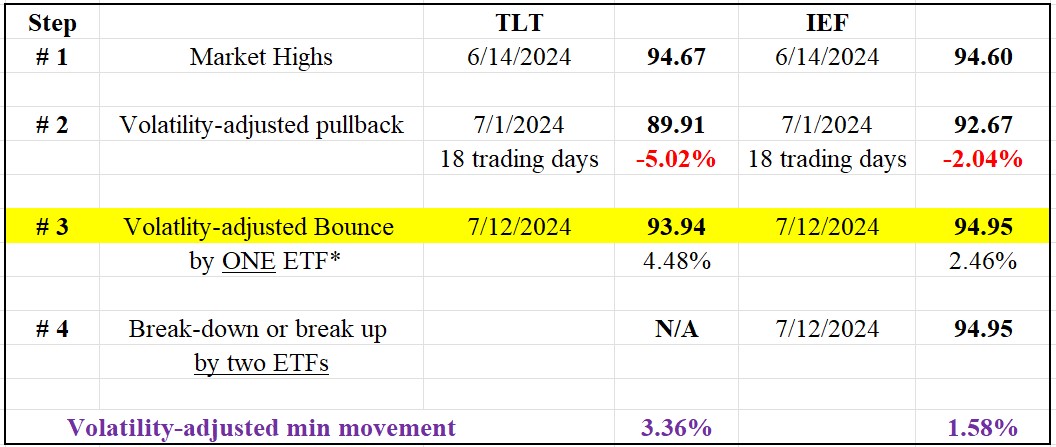
On 7/1/24, a secondary (bearish reaction) against the primary bull market was signaled. From its 6/14/24 closing highs, TLT and IEF dropped for 10 trading days, which satisfied the time requirement for a secondary reaction. The pullback also exceeded the Volatility-Adjusted Minimum Movement (VAMM, more about it here), so the extent requirement for a secondary reaction was also met.

Following the closing lows on 7/1/24, a strong rally ensued, setting up TLT and IEF for a potential primary bear market signal.

The Table below shows all the information you need:

 Table Dow Theory short term TLT IEF

 So, now we have the following options:

1) A primary bear market would be signaled if TLT and IEF jointly break below their 7/1/24 closing lows.

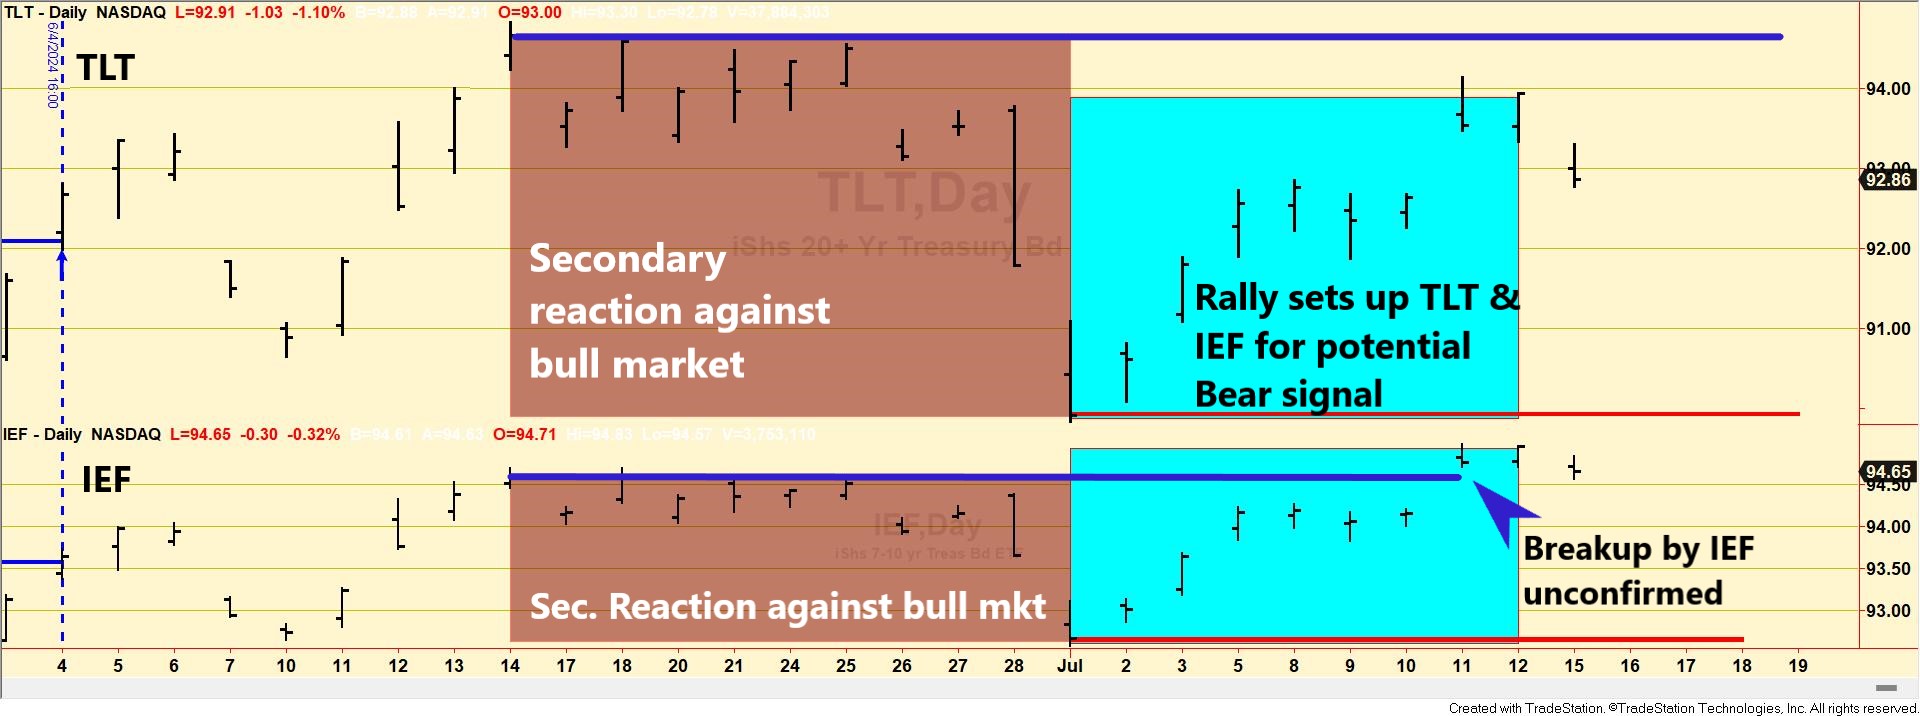
2) If TLT and IEF jointly break above their 6/14/24 bull market highs, the primary bull market would be confirmed, the secondary reaction extinguished, and the setup for a bear market signal canceled. IEF, has already surpassed its 6/14/24 highs unconfirmed by TLT. The longer it takes for TLT to confirm, the more suspect the breakup.

The charts below give you a glimpse of the current situation. The red horizontal lines highlight the 7/1/24 lows whose confirmed violation would signal a new primary bear market. The blue horizontal lines highlight the 6/14/24 bull market highs. The brown rectangles show the secondary reaction, and the blue ones show the recent rally that completed the setup for a potential primary bear market.

email subs chart TLT and IEF EDITED

 So, now the primary trend is bullish, and the secondary one is bearish.

B) Market situation if one sticks to the traditional interpretation demanding more than three weeks and 1/3 confirmed retracement to declare a secondary reaction.

As detailed in this post, the primary trend was signaled as bearish on 2/13/24.

In this post, I explained that a secondary (bullish) reaction against the bear market was in place.

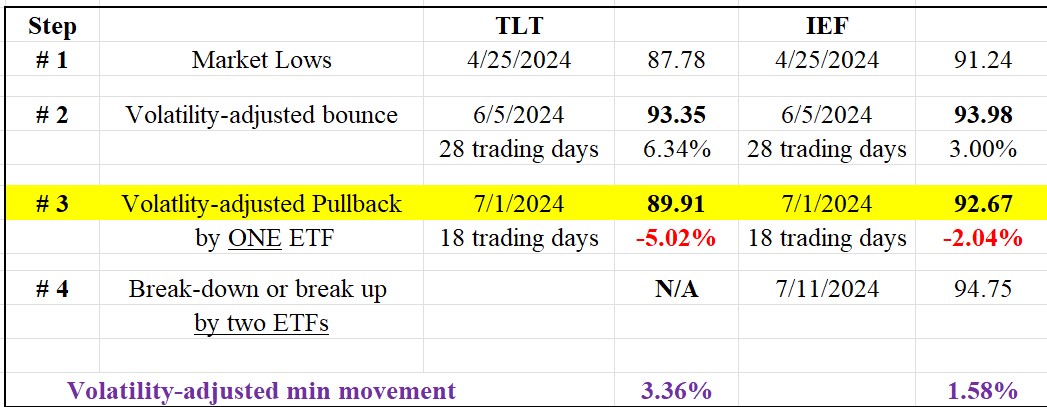
After the secondary reaction bounce, a pullback followed, setting up TLT and IEF for a potential primary bull market signal.

The Table below shows all the information you need:

Table Dow Theory LONG term TLT IEF 

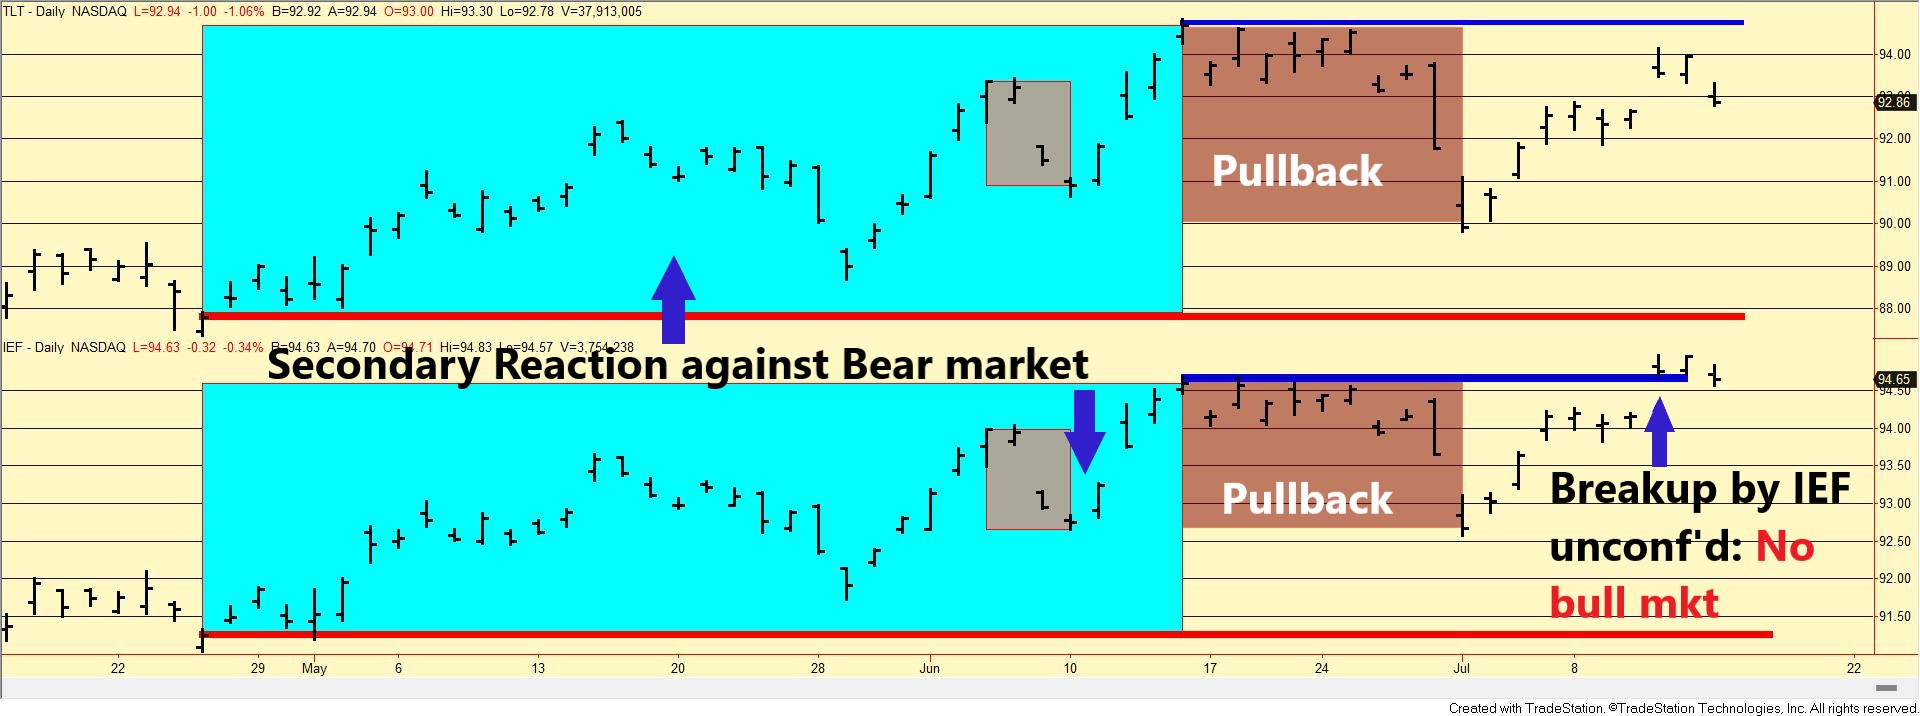
The charts below give you a glimpse of the current situation. The red horizontal lines highlight the 4/25/24 lows, whose confirmed violation would confirm the primary bear market. The blue horizontal lines highlight the 6/14/24 bull highs, whose breakup would signal a new bull market. The blue rectangles show the secondary reaction, and the brown ones show the recent pullback that completed the setup for a potential primary bull market. The grey rectangles highlight a pullback that did not meet the extent requirement to complete the setup for a bull signal.

email subs chart TLT and IEF dow theory long term edited

Therefore, the primary trend is bearish, and the secondary one is bullish. 

Sincerely,

Manuel Blay

Editor of thedowtheory.com