But not there yet!
General Remarks:
In this post, I provided a thorough explanation concerning the rationale behind my use of two alternative definitions to appraise secondary reactions.
TLT is the iShares 20 years + Treasury bond ETF. More about it here
IEF is the iShares 7-10 years Treasury bond ETF. More about it here.
Thus, TLT tracks longer-term US bonds, whereas IEF tracks middle-term US bonds. A bull market in bonds entails lower interest rates. A bear market in bonds represents higher interest rates.
A) Market situation if one appraises secondary reactions not bound by the three weeks and 1/3 retracement dogma.
As I explained here, the primary trend was signaled as bullish on 7/22/22
In my 8/26/22 post, I explained the development of a secondary (bearish) reaction against the primary bull market.
The secondary reaction has relentlessly declined, and there has not been a rally lasting at least two trading days on TLT and IEF. Hence, the usual primary bear market signal setup has not been completed. Absent the typical setup, our alternative primary bear market signal is the last primary bear market closing lows (6/14/22 @ 108.81 for TLT and 98.15 for IEF).
On 9/6/22, TLT broke down below its 6/14/22 primary bear market lows unconfirmed by IEF. As of this writing (9/13/22), IEF remains above its 6/14/22 closing lows. Absent confirmation, no primary bear market has been signaled. The primary trend remains bullish, and the secondary is bearish. A primary bear market would be signaled if/when IEF breaks below its 6/14/22 closing lows.
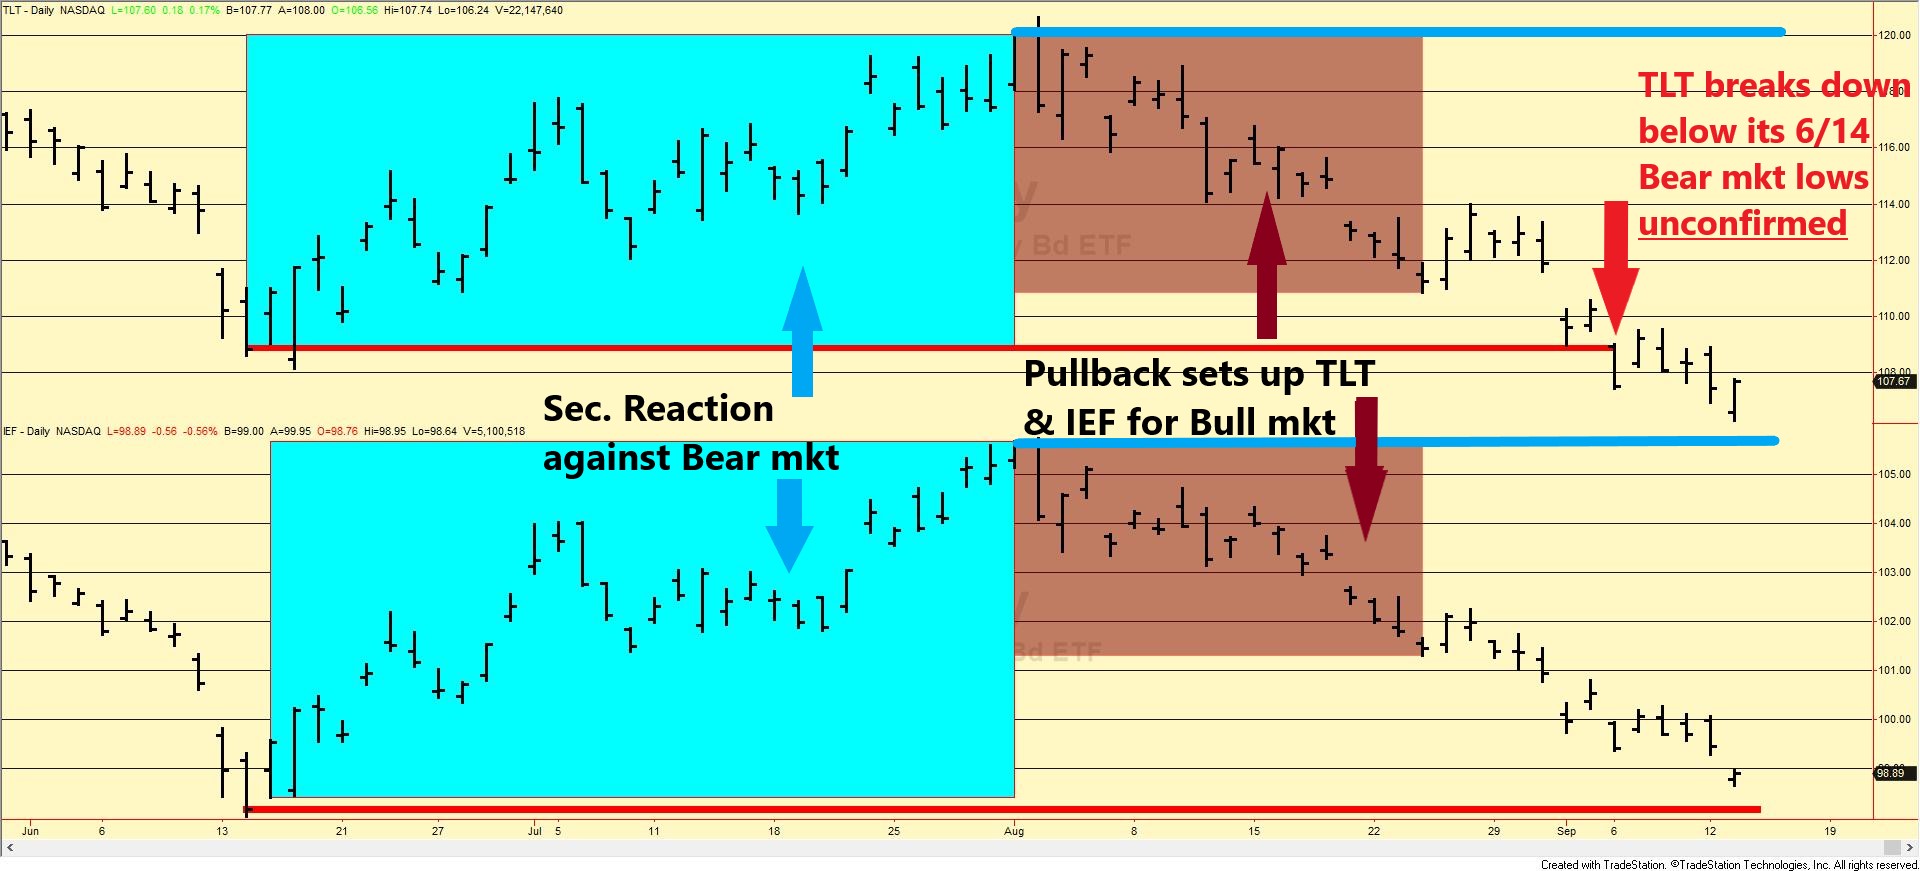
Below you have the updated charts. The brownish rectangles display the secondary reaction against the primary bull market. The small grey rectangles (see grey arrows pointing at them) show the small rally that did not reach two confirmed days and, accordingly, did not suffice to result in the standard setup for a primary bear market. Absent the typical setup, the last recorded primary bear market closing lows (red horizontal lines) are the relevant levels to be broken downside for a primary bear market signal. Until now, only TLT pierced such levels (red arrow). IEF has not confirmed.

B) Market situation if one sticks to the traditional interpretation demanding more than three weeks and 1/3 confirmed retracement to declare a secondary reaction.
The primary trend was signaled as bearish on 9/28/21. A more aggressive and legitimate interpretation would have signaled the bear market on 9/24/21. The explanations here.
I explained in my 8/26/22post the development of a secondary (bullish) reaction against the primary bear
market and the setup for a potential primary bull market signal.
On 9/6/22, TLT broke down below its 6/14/22 bear market lows, unconfirmed by IEF. Hence, the bullish secondary reaction has not been terminated. If/when, IEF breaks downside its 6/14/22 bear market lows, three technical events will happen:
a) The primary bear market will be reconfirmed.
b) The secondary (bullish) reaction against the primary bear market will be canceled.
c)
The
setup for a potential primary bull market signal will be canceled too.
The charts below focus on the most recent price action, namely the most recent rally (secondary bullish reaction against the primary bear market, shown with a blue rectangle) and the most recent pullback that set up both ETFs for a potential primary bull market (shown with a brownish rectangle). The blue horizontal lines highlight the secondary reaction highs, the relevant levels to be broken topside for a new bull market to be signaled. The red horizontal lines display the 6/14/22 primary bear market lows to be broken down by both ETFs to cancel the current secondary reaction.
General remark:
As with any long-term trading system that seldom triggers signals, performance should be evaluated by taking a sufficiently long observation period (I'd say at least 5-6 years for a portfolio and 10 years if dealing with one asset class alone). The link below offers you an evaluation of the outperformance and drawdown reduction operated by the Dow Theory when appraising the trend with TLT and IEF:
http://www.dowtheoryinvestment.com/2022/03/dow-theory-update-does-dow-theory-work_22.html
Sincerely,
Manuel Blay
Editor of thedowtheory.com
No comments:
Post a Comment