Monday, December 23, 2024

Dow Theory signal: Bear Market for Gold and Silver Miners triggered on 12/18/24

 Analyzing the Impact of Powell’s Hawkish Stance on GDX and SIL

Overview: All markets, gold and silver miners included, reacted negatively to Powell’s more hawkish stance, as investors had anticipated more substantial and frequent rate cuts. The big drop GDX and SIL experienced on 12/18/24 triggered a primary bear market signal.

The precious metals themselves, gold and silver, are not in a Bear market, as SLV’s lower lows were not confirmed by GLD, which displayed good relative strength.  However, if GLD pierced on a closing basis, its 11/15/24 secondary reaction low at 236.59, a primary bear market would be signaled. So, the primary trend remains bullish, and the secondary one is bearish, as explained HERE.

General Remarks:

In this post, I extensively elaborate on the rationale behind employing two alternative definitions to evaluate secondary reactions.

SIL refers to the Silver Miners ETF. More information about SIL can be found HERE.

GDX refers to the Gold Miners ETF. More information about GDX can be found HERE.

A) Market situation if one appraises secondary reactions not bound by the three weeks and 1/3 retracement dogma 

As I explained in this post, the primary trend was signaled as bullish on 4/3/24.

My 11/19/24 post started to sound the alarms concerning a possible bear market signal on the horizon.

On 12/18/24, GDX and SIL jointly pierced their respective secondary reaction lows (11/13/24 for SIL and 11/15/24 for GDX), as shown in Step #2 in the table below. Such a confirmed breakdown shifted the trend from bullish to bearish.


So, the primary and secondary trends are bearish now.

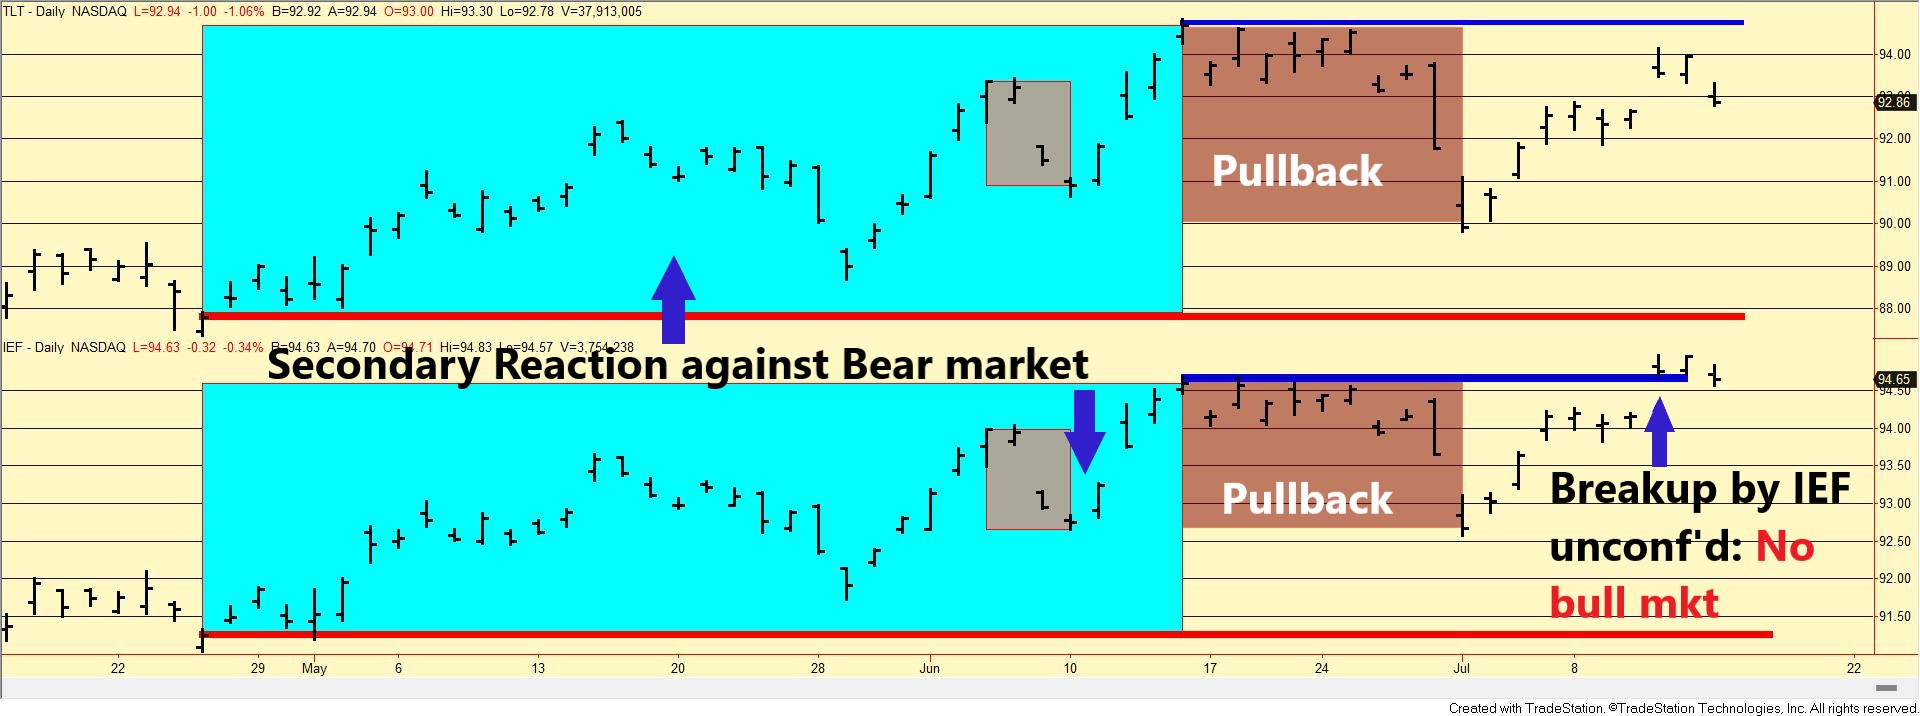
The following charts depict the latest price movements. Brown rectangles indicate the secondary (bearish) reaction opposing the ongoing primary bull market. Blue rectangles highlight the recent rally that fulfilled the setup for a potential primary bear market (Step #3). Red horizontal lines mark the secondary reaction lows (Step #2). The blue horizontal lines show the bounce highs (Step #3), which independently also satisfy the time and extent requirement for a secondary reaction. A breach of these peaks would signal a new primary bull market, though this scenario appears unlikely in the near term.

So, the situation is as follows: At the current juncture, a breakup on a closing basis by both GDX and SIL of the 12/6/24 closing highs (Step #3) would signal a new bull market. Until this breakup occurs, we consider bonds in a bear market.

B) Market situation if one sticks to the traditional interpretation demanding more than three weeks and 1/3 confirmed retracement to declare a secondary reaction.

As I explained in this post, the primary trend was signaled as bullish on 7/31/24.

My 11/29/24 post started to sound the alarms concerning a possible bear market signal on the horizon.

In this instance, the long-term application of the Dow Theory coincides with the shorter-term version, so a primary bear market signal has been triggered on 12/18/24.

Sincerely,

Manuel Blay

Editor of thedowtheory.com


Beating the S&P 500: Why Your Stock Picks Might Be Falling Short

 The 40-Day Sweet Spot: Rethinking Your Stock Holding Period

Most S&P500 constituents fail to outperform the Index in the long run. The evidence provided by Kurtis Hemmerling in his LinkedIn post is compelling and highlights this challenge for individual stock pickers.

So, if you buy stocks for the long haul, the odds are greatly stacked against you. Buy and hold does not work. Neither for the Indexes, much less for individual stocks.

What to do to have a decent change of being a winner in the stock market?

1) Buy-and-hold investing in a portfolio of stocks is a recipe for underperformance. One cannot fall in love with a specific stock. The investor needs clear rules for when to buy and sell. The specific criteria for effective buying and selling will be addressed in a future discussion.

2) Shorten your holding period. Over shorter timeframes, such as a quarter, more stocks have the potential to outperform the S&P 500, even though eventually they will fizzle out. The table below, which I produced some months ago, shows that the “sweet” point for holding stocks is 40 days, as this holding period results in most stocks outperforming the index.

3) And last but not least, employ a reliable trend-following indicator. All stocks tend to decline during bear markets regardless of their individual merits. Our Composite Indicator does a great job in identifying market turns.

Interestingly, stocks are better timed by focusing on the overall market trend rather than their individual trends. This is because the signal-to-noise ratio of individual stocks is higher and more prone to false signals, while the market as a whole provides a more reliable indicator of its own trend and that of its constituent stocks (source: “Stock Market Cash Trigger“, David Alan Carter).

Does it entail more work? Yes, but the reward is less drawdowns and more outperformance. There are no shortcuts in the stock market, and success requires diligence and a well-thought-out strategy.

Sincerely,

Manuel Blay

Editor of thedowtheory.com


Thursday, December 19, 2024

Dow Theory Signals Bear Market in Bonds on 12/18/24

Powell’s Hawkish Tone Triggers Major Shifts in TLT and IEF

Overview: All markets, notably bonds, reacted negatively to Powell’s more hawkish stance, as investors had anticipated more substantial and frequent rate cuts. The big drop TLT and IEF experienced on 12/18/24 triggered a primary bear market signal.

Later today, or tomorrow, I will write about the bear market signal triggered also on 12/18/24 for the gold and silver miners ETFs (GDX & SIL).

General Remarks:

In this post, I extensively elaborate on the rationale behind employing two alternative definitions to evaluate secondary reactions.

TLT refers to the iShares 20+ Year Treasury Bond ETF. You can find more information about it here

IEF refers to the iShares 7-10 Year Treasury Bond ETF. You can find more information about it here.

TLT tracks longer-term US bonds, while IEF tracks intermediate-term US bonds. A bull market in bonds signifies lower interest rates, whereas a bear market in bonds indicates higher interest rates.

A) Market situation if one appraises secondary reactions not bound by the three weeks and 1/3 retracement dogma 

As I explained in this post, the primary trend shifted to bullish on 6/4/24.

My 11/29/24 post started to sound the alarms concerning a possible bear market signal on the horizon.

On 12/18/24, TLT and IEF jointly pierced their respective secondary reaction lows (11/13/24 for TLT and 11/6/24 for IEF), as shown in Step #2 in the table below. Such a confirmed breakdown shifted the trend from bullish to bearish.


 So, the primary and secondary trends are bearish now.

The following charts depict the latest price movements. Brown rectangles indicate the secondary (bearish) reaction opposing the ongoing primary bull market. Blue rectangles highlight the recent rally that fulfilled the setup for a potential primary bear market (Step #3). Red horizontal lines mark the secondary reaction lows (Step #2). The blue horizontal lines show the bounce highs (Step #3), which independently also satisfy the time and extent requirement for a secondary reaction. A breach of these peaks would signal a new primary bull market, though this scenario appears unlikely in the near term.


So, the situation is as follows: At the current juncture, a breakup on a closing basis by both TLT and IEF of the 12/6/24 closing highs (Step #3) would signal a new bull market. Until this breakup occurs, we consider bonds in a bear market.

B) Market situation if one sticks to the traditional interpretation demanding more than three weeks and 1/3 confirmed retracement to declare a secondary reaction.

As I explained in this post, the primary trend was signaled as bullish on 7/31/24.

My 11/29/24 post started to sound the alarms concerning a possible bear market signal on the horizon.

In this instance, the long-term application of the Dow Theory coincides with the shorter-term version, so a primary bear market signal has been triggered on 12/18/24.

Sincerely,

Manuel Blay

Editor of thedowtheory.com


Friday, November 29, 2024

Bonds at crossroads: Set up for a potential bear market signal for TLT and IEF completed on 11/27/24

Dissecting the most recent price action for TLT & IEF. Key price levels to monitor

Overview: the most recent rally within an extended secondary (bearish) reaction has set up TLT and IEF for a potential primary bear market signal. The trend remains bullish to this day, but if the key prices I show in this post are jointly pierced, a new bearish trend will be signaled.

General Remarks:

In this post, I extensively elaborate on the rationale behind employing two alternative definitions to evaluate secondary reactions.

TLT refers to the iShares 20+ Year Treasury Bond ETF. You can find more information about it here

IEF refers to the iShares 7-10 Year Treasury Bond ETF. You can find more information about it here.

TLT tracks longer-term US bonds, while IEF tracks intermediate-term US bonds. A bull market in bonds signifies lower interest rates, whereas a bear market in bonds indicates higher interest rates.

A) Market situation if one appraises secondary reactions not bound by the three weeks and 1/3 retracement dogma 

As I explained in this post, the primary trend shifted to bullish on 6/4/24.

Following the 9/16/24 highs, there was a substantial pullback until 11/6/24 (TLT) and 11/15/24 (TLT). This pullback amply met the time and extent requirements for a secondary reaction.

On 11/13/24, TLT violated its 7/1/24 lows unconfirmed by IEF, so no primary bear market was signaled. Thus, the primary bull market remained intact. The 7/1/24 lows are the lows of the “last completed secondary reaction” (not the current one, but the one before that was successfully terminated by higher highs). The lows of the last completed secondary reaction also serve as relevant price levels to signal a trend change when we don’t have another option at a higher price level.

A rally ensued after the 11/13/24 (TLT) and 11/6/24 (IEF) lows. This rally also met the time and extent requirement to set up both ETFs for a potential primary bear market signal.

The table below gives you the relevant dates and prices:

So, now the situation is as follows:

1. A primary bear market will be signaled if TLT and IEF jointly pierce their 11/13/24 (TLT, at 89.8) and 11/6/24 (IEF, at 93.25) closing lows.

2. The primary bull market will be reconfirmed, and the setup for a potential bear market signal canceled, if TLT and IEF jointly surpass their 9/16/24 closing highs.

The following charts depict the latest price movements. Brown rectangles indicate the secondary (bearish) reaction opposing the ongoing primary bull market. Blue rectangles highlight the recent rally that fulfilled the setup for a potential primary bear market (Step #3). Red horizontal lines mark the secondary reaction lows (Step #2), while blue horizontal lines show the primary bull market peaks. A breach of these peaks would reaffirm the primary bull market, though this scenario appears unlikely in the near term.

Therefore, the primary trend is bullish, and the secondary trend is bearish.

B) Market situation if one sticks to the traditional interpretation demanding more than three weeks and 1/3 confirmed retracement to declare a secondary reaction.

As I explained in this post, the primary trend was signaled as bullish on 7/31/24.

The most recent pullback meets the time (>=15 trading days) and extent requirement for a secondary reaction. And the most recent rally, has also set up TLT and IEF for a potential primary bear market signal.

In this instance, the long-term application of the Dow Theory coincides with the shorter-term version, so there was a secondary reaction against the primary bull market and the most recent rally set up both ETFs for a potential primary bear market signal.

Sincerely,

Manuel Blay

Editor of thedowtheory.com


Friday, November 22, 2024

Gold and Silver at a Crossroads: Bull Continuation or Bear Market Ahead?


Breaking Down Gold and Silver: A Critical Moment

Overview: In a similar fashion to the gold and Silver miner’s ETFs, gold and silver reached a make-or-break moment on 20/19/24. The setup for a potential bear market has been completed, and the line on the sand has been drawn.

In this post, we examine the key prices to observe that would signal a new primary bear market.

General Remarks:

In this post, I extensively elaborate on the rationale behind employing two alternative definitions to evaluate secondary reactions.

GLD refers to the SPDR® Gold Shares (NYSEArca: GLD®). More information about GLD can be found HERE.

SLV refers to the iShares SLVver Trust (NYSEArca: SLV®). More information about SLV can be found HERE

A) Market situation if one appraises secondary reactions not bound by the three weeks and 1/3 retracement dogma.  

As I explained in this post, the primary trend was signaled as bullish on 4/3/24.

Following the 10/22/24 (SLV) and 10/30/24 (GLD) highs, there was a pullback until 11/15/24. Such a pullback meets the time and extent requirement for a secondary (bearish) reaction against the still-existing primary bull market.

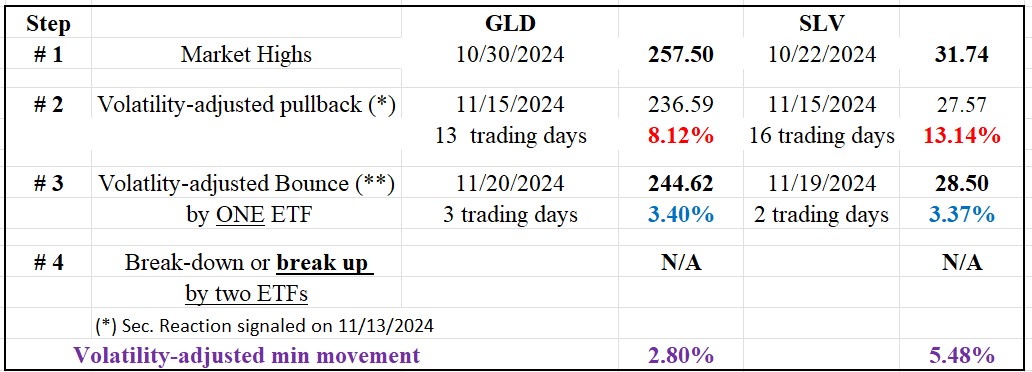
The rally that started off the 11/15/24 lows until 11/19/24 (SLV) and 11/20/24 (GLD) set up both ETFs for a potential primary bear market signal. Thus, a confirmed breakdown of the 11/15/24 (SLV at 27.57 and GLD at 236.59) would signal a new primary bear market.

Please remember that we don’t require confirmation for the final rally that completes a bear (or bull) signal setup. More information is in this post.

The table below gives you the most relevant information:

250 gld slv dow theory short term table nov 20 2024 bis

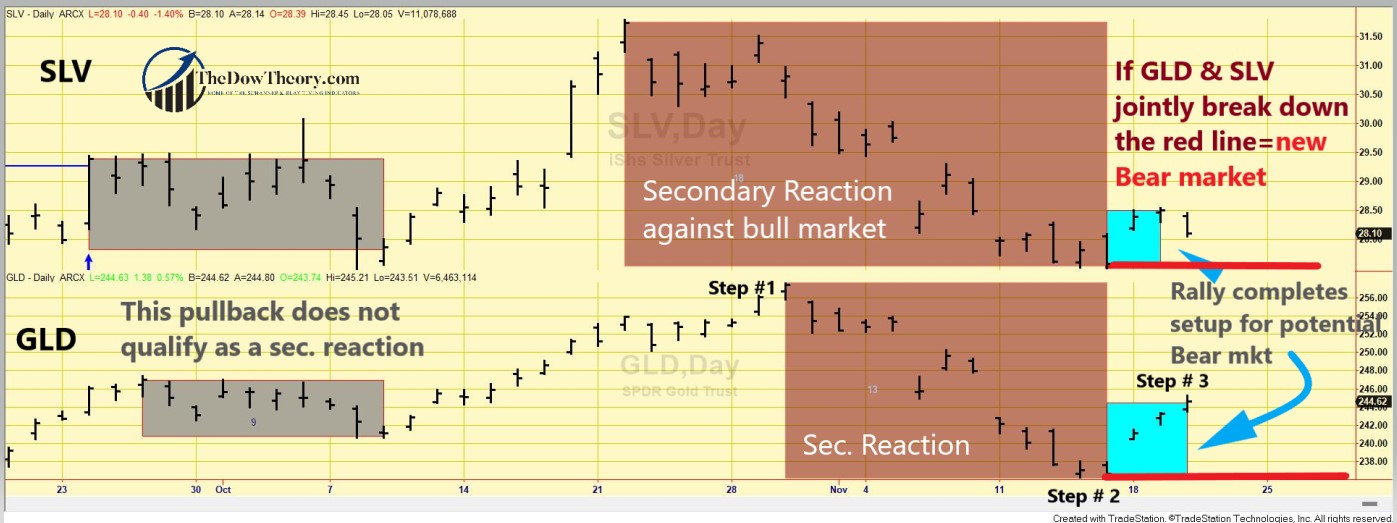
The chart below illustrates the latest price movements. The brown rectangles mark the secondary reaction against the primary bull market (Step #2). The blue rectangles indicate the rally (Step #3), positioning GLD and SLV for a potential bear market signal. The red horizontal lines show the secondary reaction lows (Step #2), where a confirmed break would signal a new primary bear market. The grey rectangles display a minor pullback that did not qualify as a secondary reaction.

 251 gld slv dow theory short term chart nov 20 2024 EDITED

 So, now we have two options:

  1. If GLD and SLV jointly break down their 11/15/24 (SLV at 27.57) and 11/15/24 (GLD at 236.59) lows, a new primary bear market would be signaled.
  2. If GLD and SLV jointly surpass their 10/22/24 (SLV) and 10/30/24 (GLD) highs, the primary bull market would be reconfirmed, and the secondary reaction and bearish setup would be canceled.

So, now, the primary trend is bullish, and the secondary one is bearish.

B) Market situation if one sticks to the traditional interpretation demanding more than three weeks and 1/3 confirmed retracement to declare a secondary reaction.

I explained in this post that the primary trend was signaled as bullish on 4/2/24.

The current pullback did not reach 15 confirmed days by both ETFs, so there is no secondary reaction against the bull market.

So, the primary and secondary trends are bullish under the “slower” appraisal of the Dow Theory.

Sincerely,

Manuel Blay

Editor of thedowtheory.com


Thursday, November 21, 2024

When Trends Speak Louder Than Data: Why Trend Following Wins Against Macro Investing

 AI’s Verdict: Trend Following Trumps Macro in the Investment Arena

I often receive emails highlighting macroeconomic data that supposedly contradicts or challenges the signals provided by price action—or trend-following—in markets like stocks, crypto, bonds, etc. These messages can give the impression that trend-following alone isn’t enough to keep us on the right side of the market, or worse, that the latest piece of fundamental information might derail the message given by price action.

While I do monitor certain fundamental variables that could hint at a potential trend shift, I want to stress a core principle: price action always comes first. If something is trending upward, it’s usually better to follow the trend rather than overanalyze or second-guess.

If fundamentals seem to clash with an uptrend, it’s a signal to manage risk more carefully—tightening stops or selling fully instead of partially if a breakdown occurs. However, avoiding buying or selling prematurely just because of a concerning macro factor can often lead to missed opportunities. Let the price guide your decisions.

Undoubtedly, intelligent authors pen these dense macro reports, but their track records often fall short of expectations. These fundamental reports can be so convincing that I would frequently take the bait if I weren’t a staunch trend follower.

While I’ve always known that trend-following strategies have historically outperformed those based on fundamental analysis—no matter how compelling macro predictions may seem—I wanted to get an objective perspective. To do so, I turned to AI Perplexity and asked the following question:

“There are several approaches to investing. One is ‘macro,’ which focuses on economic variables like unemployment, interest rates, GDP, etc. Macro investors try to forecast future market prices and profit from them by analyzing economic variables. On the other hand, there are trend followers who only focus on price action and disregard the economic data. Please check existing funds and hedge funds based on these two approaches and tell me which has historically had better performance and less drawdown.”

The response I received was enlightening and supported my inclination towards trend following. Here’s a summary of the key points:

[Start of AI quote]

Both global macro and trend following strategies have played significant roles in the hedge fund industry, each with its own strengths and historical performance characteristics. Global macro hedge funds analyze worldwide macroeconomic trends to identify investment opportunities across global markets, employing directional, relative value, and opportunistic trades. Notable global macro funds include AQR, Bridgewater, Citadel, and D.E. Shaw, among others. Trend following strategies, often categorized under Managed Futures or CTAs (Commodity Trading Advisors), focus on price movements rather than fundamental economic data. These strategies aim to capture medium-term price trends across various asset classes. Prominent trend following hedge funds include Winton Trend Fund, AQR, Man AHL, and Systematica. When comparing the two approaches, the AI’s analysis revealed several key advantages of trend following strategies:

  1. Long-term performance: Trend following strategies have shown to perform as well as equities in the long term, but with lower risk and smaller drawdowns. The Eurekahedge Trend Following Index demonstrates positive annual returns in most years since 2000, with particularly strong performances during market crises.
  2. Drawdown profile: Trend following strategies generally exhibit a more favorable drawdown profile compared to macro funds and equity markets. Maximum drawdowns for trend following strategies tend to be around 1.5 times their annualized volatility, compared to almost 3.5 times for equities.
  3. Crisis performance: Trend following strategies have shown exceptional performance during market crises. For example, during the 2008 financial crisis, when the S&P 500 experienced a 51% drawdown, trend following strategies gained 16.74%.
  4. Consistent profitability: A study examining trend following performance from 1880 to 2016 found that the strategy has been consistently profitable throughout this 137-year period.

While both strategies offer diversification benefits to traditional portfolios, trend following has shown particularly strong performance during equity market crises. A 50/50 combination of trend following and equity markets has been shown to increase the Sharpe ratio for equity markets by 66% and reduce the maximum drawdown from 51% to 22%. Based on this analysis, trend following strategies appear to have better average performance and less drawdown compared to macro funds. They have demonstrated more consistent positive returns over long periods, shallower drawdowns, better performance during market crises, and strong recent performance. “

[end of AI quote]

I downloaded and plotted the Eurekahege Trend Following Index performance data against the Macro Index from December 1999 to October 2024. Both Indexes are based on an equally weighted index of many funds that invest in stocks, futures, commodities, interest rates, etc.

The chart shows that trend-following beats macro:


The trend-following index delivers an average annual return of 8.83%, outperforming the macro index’s 7.71%. Notably, our trend-following indicator, The Dow Theory for the 21st Century (DT21C) has performed even better than both, as demonstrated HERE. This is particularly impressive given that our model performance was obtained by relying solely on the Dow Industrials and operates only on long positions. In contrast, the trend-following and macro indices utilize long/short strategies across a wide range of markets. The DT21C’s outperformance highlights the precision and effectiveness of our highly refined trend-following methodology. .

While this is not an indictment against macro, the takeaway is clear: An information overload need not necessarily translate into more performance. I want to spend my time becoming a better trend follower and, notably, creating good trend-following portfolios that are better than the sum of their parts rather than breaking my head trying to figure out which economic variable will influence the stock market’s next move.

This information reinforces my commitment to trend following as a primary investment strategy. While macro analysis can provide valuable insights, the historical evidence suggests that following price action and trends has been more reliable and profitable. As always, it’s important to remember that past performance does not guarantee future results, and the effectiveness of these strategies can vary depending on market conditions and implementation. However, the data strongly supports the notion that price action indeed trumps everything when it comes to investing.

Sincerely,

Manuel Blay

Editor of thedowtheory.com


Wednesday, November 20, 2024

Precious Metals Miners at a Crossroads: Bull Continuation or Bear Market Ahead?


Breaking Down the Gold and Silver Miners ETF: A Critical Moment

Overview: The gold and silver miners ETF reached a make-or-break moment on 11/19/24. The setup for a potential bear market has been completed, and the line on the sand has been drawn.

While gold and silver themselves have not yet completed the setup for a primary bear market, a continuation of the recent rally could soon lead to such a scenario.

General Remarks:

In this post, I extensively elaborate on the rationale behind employing two alternative definitions to evaluate secondary reactions.

SIL refers to the Silver Miners ETF. More information about SIL can be found HERE.

GDX refers to the Gold Miners ETF. More information about GDX can be found HERE.

A) Market situation if one appraises secondary reactions not bound by the three weeks and 1/3 retracement dogma.  

As I explained in this post, the primary trend was signaled as bullish on 4/3/24.

Following the 10/29/24 (SIL) and 10/22/24 (GDX) highs, there has been a pullback until 11/13/24 (SIL) and 11/15/24 (GDX). Such a pullback meets the time and extent requirement for a secondary (bearish) reaction against the still-existing primary bull market.

The rally that started off the 11/13/24 (SIL) and 11/15/24 (GDX) lows until 11/19/24 both ETFs for a potential primary bear market signal. Thus, a confirmed breakdown of the 11/13/24 (SIL at 34.60) and 11/15/24 (GDX at 35.51) would signal a new primary bear market.

Please remember that we don’t require confirmation for the final rally that completes a bear (or bull) signal setup. More information is in this post.

The table below gives you the most relevant information:

 The chart below illustrates the latest price movements. The brown rectangles mark the secondary reaction against the primary bull market (Step #2). The blue rectangles indicate the rally (Step #3), positioning GDX and SIL for a potential bear market signal. The red horizontal lines show the secondary reaction lows (Step #2), where a confirmed break would signal a new primary bear market. The grey rectangles display a minor pullback that did not qualify as a secondary reaction.

So, now we have two options:

1. If GDX and SIL jointly break down their 11/13/24 (SIL at 34.60) and 11/15/24 (GDX at 35.51) lows, a new primary bear market would be signaled.

2. If GDX and SIL jointly surpass their 10/29/24 (SIL) and 10/22/24 (GDX) highs, the primary bull market would be reconfirmed, and the secondary reaction and bearish setup would be canceled.

So, now, the primary trend is bullish, and the secondary one is bearish.

B) Market situation if one sticks to the traditional interpretation demanding more than three weeks and 1/3 confirmed retracement to declare a secondary reaction.

I explained in this post that the primary trend was signaled as bullish on 4/2/24.

The current pullback did not reach 15 confirmed days by both ETFs, so there is no secondary reaction against the bull market.

So, the primary and secondary trends are bullish under the “slower” appraisal of the Dow Theory.

Sincerely,

Manuel Blay

Editor of thedowtheory.com


Tuesday, November 19, 2024

Bullish again: Bull market signal for Bitcoin and Ethereum triggered on 11/7/24


It took a while for Ethereum to confirm Bitcoin, but it happened at last.

Let’s recap the technical landscape for Bitcoin.

Bitcoin and Ethereum made their last bear market lows on 8/5/24. A rally followed such lows until 8/23/24 (Ethereum) and 8/26/24 (Bitcoin). Such a rally qualified as a secondary reaction against the bearish trend.

Both BTC and ETHE experienced a pullback until 9/6/24. The pullback, which lasted more than two days, had enough extent to set both cryptocurrencies up for a potential primary bull market.

On 9/24/24, BTC surpassed its 8/26/24 secondary reaction highs, but ETHE did not confirm. Absent confirmation from ETHE, no new bull market was signaled.

The awaited confirmation was given by ETHE when, on 11/7/24, it finally broke up its 8/23/24 secondary reaction highs, and according to the Dow Theory, a new bull market has been signaled.

The charts below highlight the most recent price action that led to the new bull market signal. The blue rectangles showcase the secondary (bullish) reaction against the then-existing bear market. The brown rectangles highlight the pullback that set up both cryptocurrencies for a potential bull market signal. The blue horizontal lines highlight the secondary reaction highs, which were the relevant price levels to be jointly surpassed for a new bull market.


 So, the primary and secondary trends are now bullish.

As I write this post (11/14/24), Bitcoin is overbought, and I would not be surprised to see it receding from its current lofty levels to take a breather before resuming its ascent to higher highs. You may observe a huge gap in the chart, which I highlighted with a red oval. Gaps tend to get filled, so it would be normal price action if Bitcoin and Ethereum recede to fill the gap.

The Dow Theory nailed the bear market that started in mid-March 2024, and now it is back to bullish. Dow Theory signals don’t come around every day. When they do, smart money sits up and takes notice. Why? Because this isn’t just another fleeting market indicator. The Dow Theory boasts an impressive track record across diverse markets, making it the Swiss Army knife of financial forecasting, and it is much more accurate than other trend-following indicators such as moving averages. I provided the evidence HERE, HERE.

Sincerely,

Manuel Blay

Editor of thedowtheory.com

Saturday, September 21, 2024

Three Fundamental Blunders That Led Me to Trend Following


How Misplaced Trust in ‘Expert’ Opinions Led Me to Embrace Technical Analysis


If you’ve been following me for a while, you know I firmly believe in trend following. I’ve learned that price action contains most—if not all—the information you need to succeed in the stock market (or any market, for that matter). But why did I become such a staunch advocate for technical analysis and skeptical of fundamentals?

It boils down to personal experience. I’ve learned the hard way that so-called “expert” opinions are often worth nothing. Today, I’ll share with you 3 fundamental blunders I made that steered me toward the Dow Theory, relative strength, and technical analysis in general. Thankfully, none of these mistakes were catastrophic—I didn’t bet the farm—but they were eye-opening. And while I’ve taken some creative license with the names of the companies involved, the lessons are real.

Blunder 1: The Canadian Paper Company (BW) – A “Value Play” Gone Wrong

forest with timber

Back in 2009, I bought into a Canadian paper company, let’s call it “BW,” which was touted as a classic value play. According to a well-known fund manager, Mr. T, BW’s land and timber holdings far exceeded its debt, making it an absolute steal. Despite the decline in paper demand, BW had supposedly secured its markets, and its assets were valued well above its liabilities. The story was compelling, so I bought in—despite the clear downtrend in the stock.

What happened next? BW filed for bankruptcy protection. Shareholders like me were wiped out, while creditors ended up with new shares when the company emerged from bankruptcy in 2010. In short, while the company survived and became leaner and more competitive, I was left with nothing. The “value” may have materialized for someone, but not for the original shareholders.

Lesson learned: value can be elusive and not be for you, and price action never lies.

Blunder 2: The Venezuelan Gold Mine – Don’t Trust Communists

In 2006, I attended a conference where one of the directors of a gold mining company—let’s call it “BrokenGlass”—touted their big find in Venezuela. As they claimed, it was a new “El Dorado,” and the stock was set to skyrocket once mining operations began.

gold mine 2

I was skeptical. I raised my hand and asked the director if he wasn’t worried about Chávez nationalizing the mine. He reassured me they were in good standing with the government, building schools, and supporting local communities. But my instincts told me otherwise: “The f***ing Chavez is going to screw the Canadians up.”

Well, the honeymoon with the communists abruptly ended when, in 2008, Venezuela denied BrokeGlass a key environmental permit, effectively preventing the company from constructing the mine. Following this, Venezuela took steps to nationalize its gold mines.

By 2011, BrokenGlass’s stock had plummeted to just $0.10 per share.

Another hard lesson: political risk can’t be ignored no matter how compelling the story. The good thing is that I did “pass.”

Blunder 3: The Oil Exploration Company – The Slow Burn. Capital buried for almost 20 years and counting.

My third blunder is still unfolding, but the story is equally instructive. I invested in a private equity offering from a Cyprus-based oil exploration company that had secured drilling leases in Central Asia.oil drilling operation

The investment was recommended by a former big-shot analyst of an investment fund. As usual, he said that given the proven reserves and proximity of the oil to the surface, this oil-drilling operation could be profitable even with oil priced at $20, and the oil and gas reserves were huge.

The deal looked too good to pass up. Proven reserves, favorable geography, and a projection of 20x returns made it sound like a sure thing.

There was an initial private offering at $1 a share. My friend and analyst said the company was worth at least $20 a share. He expected the company to go public around one year after the private equity placement, and we would cash out with an x20 gain.

Sounds great, isn’t it?

But nothing is ever that simple. A neighboring country contested the drilling territory, leading to years of negotiations. Then came the Ukraine-Russia war, which further delayed any progress. While the company has managed to scrape together enough funding to keep the lights on, we’ve yet to see a single drop of oil, while our original stake has been dilluted by the new issuance of shares.

Now, 17 years later, my friend—who originally recommended the investment—remains optimistic. He believes we might still get a decent return, but the opportunity cost has been enormous. Even if we cash out after 20 years with an x5 return, it would still be a mediocre investment for me, amounting to an 8.3% CAGR for a high-risk, illiquid asset. The Dow Theory and my timing indicators have delivered better returns while remaining liquid and minimizing drawdowns.

The lesson here? No one can predict the future, and sometimes, even when the fundamentals seem sound, the unknowns can derail everything. And even if I manage to cash out, the return will be mediocre compared to what I could’ve achieved by simply following the trends in the market.

Bottom line: Even the best explanation of an investment theme can go wrong. We must be humble (at least when investing) and accept that we are not omniscient. Well-crafted narratives do not necessarily translate into performance. You will be ruined or prosper by price action, not words. Or, as Ed Seykota put it:

“Fundamentals that you read about are typically useless as the market has already discounted the price, and I call them “funny-mentals”. However, if you catch on early, before others believe, you might have valuable “surprise-a-mentals”.

Sincerely,

Manuel Blay

Editor of thedowtheory.com
 

Monday, September 2, 2024

Not so bullish now: Setup for a potential bear market signal for GDX and SIL completed

 The primary trend remains bullish until proven otherwise

Overview: GDX and Sil underwent a secondary reaction against the primary bull market. The recent price action resulted in a setup for a potential bear market signal being completed. Please mind the word “potential”, which implies that the primary bull market remains in force.

GDX broke up high but SIL’s weakness negated confirmation, and, thus, the bull market has not been confirmed.

Gold and Silver are in a bull market of their own, as I explained HERE.

General Remarks:

In this post, I extensively elaborate on the rationale behind employing two alternative definitions to evaluate secondary reactions.

SIL refers to the Silver Miners ETF. More information about SIL can be found HERE.

GDX refers to the Gold Miners ETF. More information about GDX can be found HERE.

A) Market situation if one appraises secondary reactions not bound by the three weeks and 1/3 retracement dogma.  

As I explained in this post, the primary trend was signaled as bullish on 4/3/24.

On 8/5/24, SIL broke down its 7/1/24 lows unconfirmed by GDX, so the primary bullish trend has not been changed.

The rally that started off the 8/7/24 lows set up both ETFs for a potential primary bear market signal. Thus, a confirmed breakdown of the 8/7/24 closing lows at 29.58 (SIL) and 34.71 (GDX) would signal a new primary bear market.

The table below gives you the most relevant information:

So, now there are two options:

  1. If SIL and GDX surpass their 7/16/24 highs on a closing basis (Step #1 in the above table), the secondary reaction and setup for a potential bear market signal will be canceled. On 8/20/24, GDX surpassed its 7/16/24 highs unconfirmed by SIL. So, the technical situation has not changed.
  2. A primary bull market will be signaled if SIL and GDX break down below their 8/7/24 lows.

The charts below illustrate recent price movements. The brown rectangles highlight the secondary reaction within the primary bear market. The small blue rectangles on the right show the initial days of a rally that set up both ETFs for a potential primary bear market signal. The blue horizontal lines indicate the last recorded primary bull market highs that must be surpassed to reconfirm the bull market (Step #1). The red horizontal lines highlight the 8/7/24 lows (Step #2).

As of this writing, the primary trend is bullish, and the secondary one is bearish.

B) Market situation if one sticks to the traditional interpretation demanding more than three weeks and 1/3 confirmed retracement to declare a secondary reaction.

In this post, I explained that the primary trend was signaled as bullish on 4/3/24.

In this instance, the long-term application of the Dow Theory coincides with the shorter-term version, so there was a secondary reaction against the primary bull market and the setup for a potential bear market signal has been completed.

As of this writing, the primary trend is bullish, and the secondary one is bearish.

Sincerely,

Manuel Blay

Editor of thedowtheory.com


Thursday, August 1, 2024

From Indecision to Confirmation: US Bonds Show Clear Bullish Trends

 Exploring the Bullish Implications of TLT’s Recent Breakout

Overview: On 7/15/24, I wrote that there was indecision concerning the trend for US bonds. Depending on the time frame one got contradictory readings. You can get the details here.

The indecision is over. On 7/31/24, TLT (long-term maturity bonds ETF) surged higher, which has bullish implications in all time frames, as I will explain below.

Lower interest rates reflect lower inflation or a downturn in the economy. I think both. As my August 1st Letter to Subscribers explained, I have solid economic reasons not to buy easily into the soft-landing narrative. Inflation will only go lower if the economy cools down.

So, let’s get started with the Dow Theory analysis.

General Remarks:

In this post, I extensively elaborate on the rationale behind employing two alternative definitions to evaluate secondary reactions.

TLT refers to the iShares 20+ Year Treasury Bond ETF. You can find more information about it here

IEF refers to the iShares 7-10 Year Treasury Bond ETF. You can find more information about it here.

TLT tracks longer-term US bonds, while IEF tracks intermediate-term US bonds. A bull market in bonds signifies lower interest rates, whereas a bear market in bonds indicates higher interest rates.

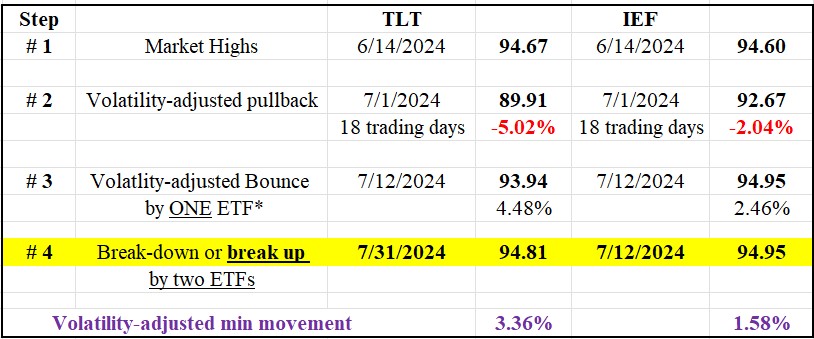
A) Market situation if one appraises secondary reactions not bound by the three weeks and 1/3 retracement dogma 

As I explained in this post, the primary trend shifted to bullish on 6/4/24.

On 7/1/24, a secondary (bearish reaction) against the primary bull market was signaled (you can find all the details of the secondary reaction here)

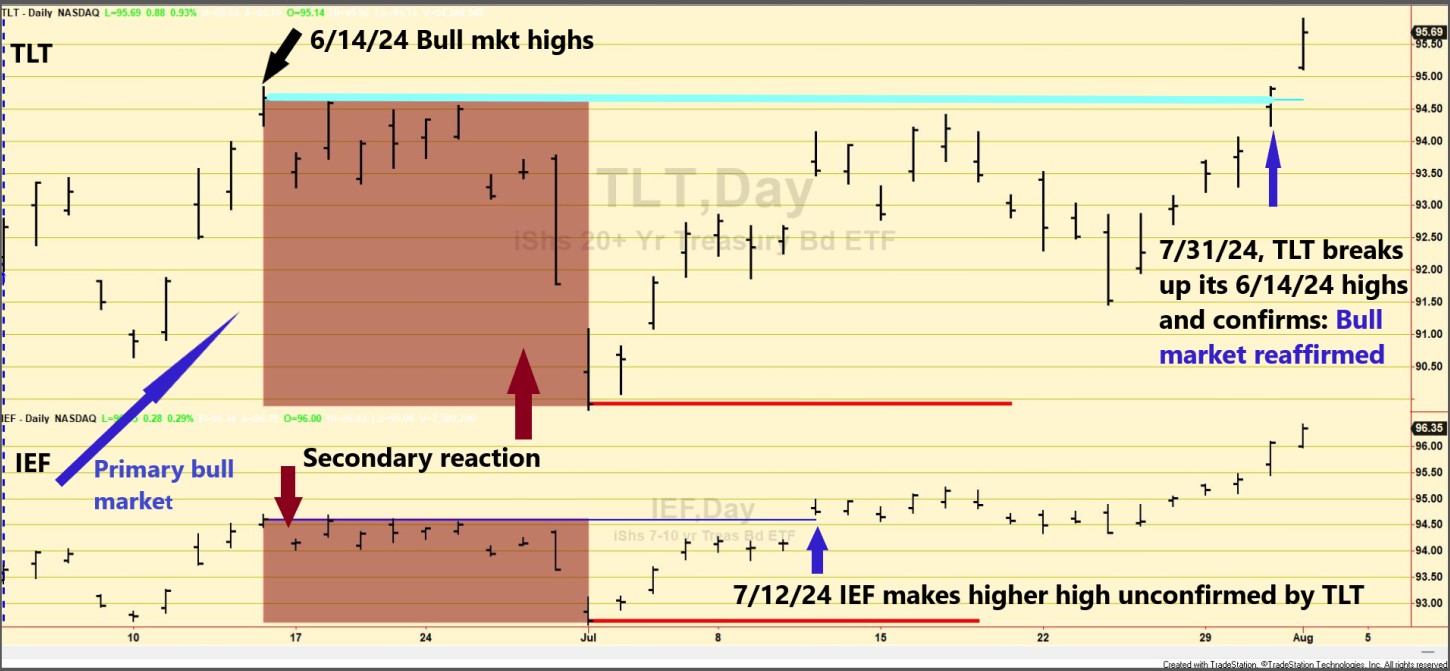
On 7/12/24, IEF surpassed its 6/14/24 primary bull market closing highs unconfirmed by TLT.

On 7/31/24, TLT broke up its 6/14/24 primary bull market closing highs and provided confirmation.

The table below gives you the relevant dates and prices:

218 TLT and IEF short term Dow Theory August 1st 2024

The betterment of the last recorded primary bull market highs implies:

  1. The secondary (bearish) reaction against the primary bull market has been terminated.
  2. The setup for a potential primary bear market signal has been canceled.
  3. The primary bull market has been reaffirmed.
  4. A primary bear market would be signaled if TLT and IEF jointly violated their 7/1/24 closing lows. Presently, this is a very unlikely event.

The charts below give you a glimpse of the current situation. The red horizontal lines highlight the 7/1/24 lows, and the blue horizontal lines highlight the 6/14/24 bull market highs. The brown rectangles show the secondary reaction, which has been canceled.

219 TLT and IEF CHART DOW THEORY SHORT TERM AUGUST 1 2024 EDITED

Therefore, the primary and secondary trends are now bullish.

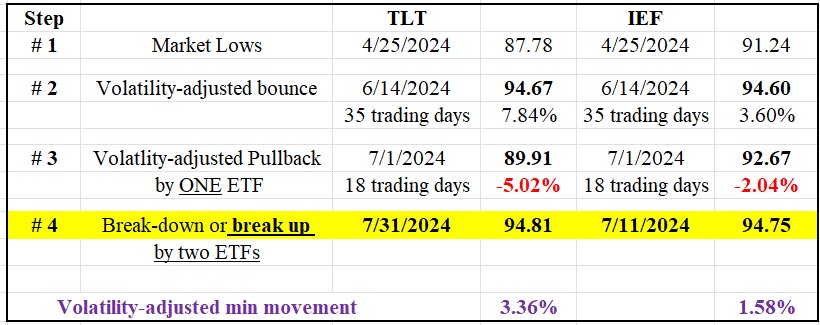
B) Market situation if one sticks to the traditional interpretation demanding more than three weeks and 1/3 confirmed retracement to declare a secondary reaction.

As detailed in this post, the primary trend was signaled as bearish on 2/13/24.

In this post, I explained that a secondary (bullish) reaction against the bear market was in place.

A pullback followed after the secondary reaction bounce, setting up TLT and IEF for a potential primary bull market signal. You can get more details in this post.

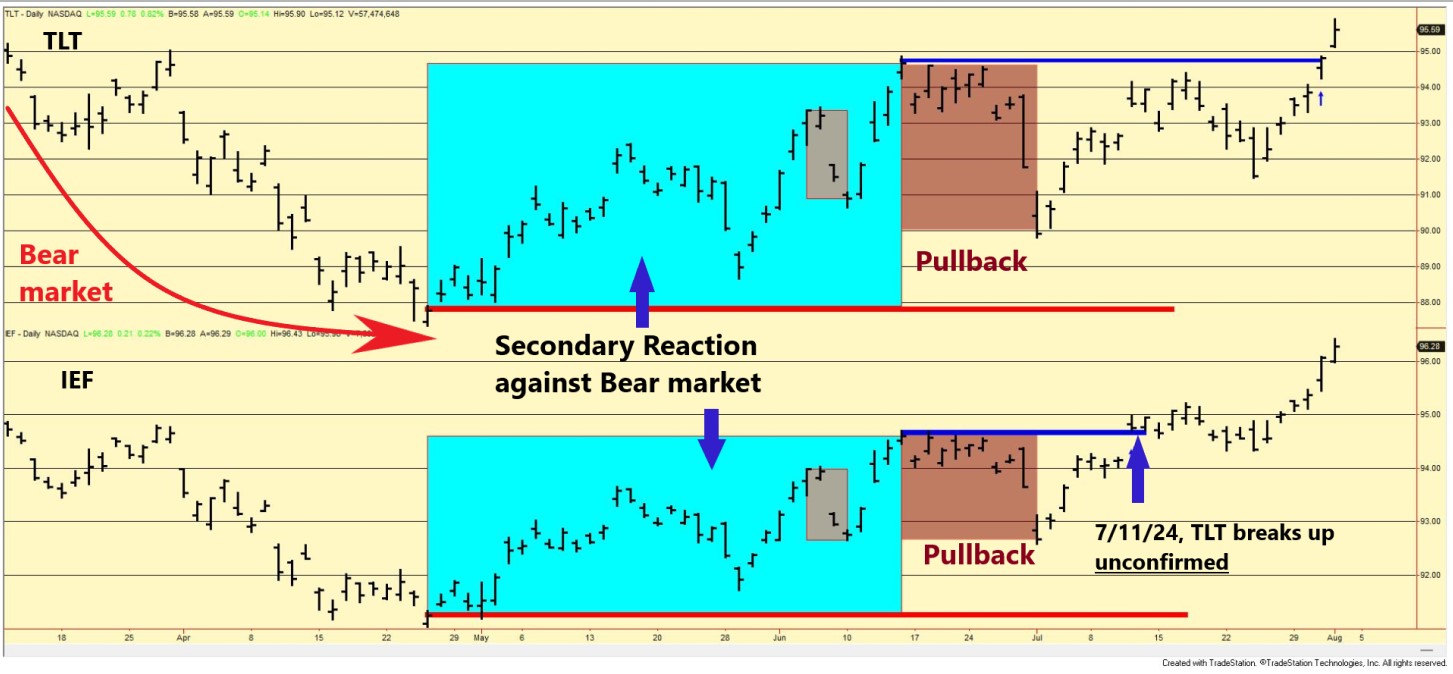
On 7/11/24, TLT surpassed its 6/14/24 secondary reaction highs, unconfirmed by TLT. Absent confirmation, no new bull market was signaled.

On 7/31/24, TLT finally broke above its 6/14/24 secondary reaction highs, provided confirmation, and, thus, signaled a new primary bull market.

The table below gives you the relevant dates and prices:

218 TLT and IEF long term Dow Theory August 1st 2024 3

The charts below give you a representation of the most recent price action. On the left, we see the bear market in action with lower prices until a secondary reaction (blue rectangles) interrupted the decline. Following the 6/14/24 secondary reaction highs, there was a pullback until 7/1/24 (brown rectangles) that set up TLT and IEF for a potential primary bull market signal. The blue lines highlight the secondary reaction highs, which were the critical level to be jointly surpassed for a new bull market. The red horizontal lines show the 4/25/24 bear market lows, whose confirmed violation would signal a new bear market.220 TLT IEF DOW THEORY LONG TERM AUGUST 1 2024 EDITEDTherefore, we have the following technical situation:

  1. The primary trend shifted to bullish.
  2. The secondary trend is now also bullish.

Sincerely,

Manuel Blay

Editor of thedowtheory.com


Monday, July 22, 2024

Will Small Caps Continue Outperforming Large Caps?


Understanding Small Cap Stocks in the Current Market

Will small caps continue outperforming large caps for a considerable time? Or have we just seen a flash in the pan? This is a question on many investors’ minds. While recent trends might suggest a resurgence of small-cap stocks, as shown by the chart below, the broader market dynamics hint at a different story.


I am convinced we are heading into a “winner-takes-all” economy, as Mark Hulbert (WSJ) has been suggesting since 2017.

Globalization and technology have created favorable conditions for mega companies like Apple, Amazon, and Facebook. These behemoths are leveraging their scale and technological advancements to dominate markets worldwide.

Even if globalization somehow unwinds, technology will continue to offer an advantage to tech-dominated global companies. The rapid pace of technological innovation ensures that large-cap companies with substantial resources can stay ahead of the curve, continuously improving efficiency and market reach.

Furthermore, the regulatory environment, which places undue compliance burdens on companies, clearly favors the big guy over the small guy. Large companies have the resources to navigate complex regulations, whereas smaller companies often struggle to keep up. So, I would not be surprised to see large-cap stocks outperforming their small peers for a long time. I am not saying that all small caps are doomed, but many will suffer.

The U.S. Advantage in the Global Economy

In the same vein as large companies, the USA is the country best placed to profit from the new normal. In fact, it has been taking the lead since at least 2009, as attested by the U.S. stock market performance vs its European peers. The U.S. has consistently shown resilience and earnings growth for shareholders, driven by its robust economic policies, innovation, and global influence.

I follow stock trends, but even more vital is to follow countries’ trends. Monitoring the economic health and policies of different countries can provide valuable insights into market movements and investment opportunities.

Key Takeaways for Investors

  1. U.S. Market Attractiveness: Despite its challenges, the USA remains one of the most attractive destinations for capital. It is the “less dirty shirt in the laundry basket” by a long shot. I don’t buy into the thesis that Europe or Emerging markets are cheap. They are cheap for good reason: They lack earnings and have dire perspectives unless they dramatically change their economic policies.
  2. U.S. Stock Indexes and Trend Following: Given that many U.S. (and world) companies are having and are likely to have a hard time in the future, stock indexes coupled with trend following to protect against the downside is my undisputable bet. What kind of trend following? Many trend-following systems are suboptimal and don’t stand scrutiny. The trend-following system must provide you with a track record spanning at least +20 years and have survived several bear markets. My trend-following systems boast a record starting as far back as 1953, so we can trade them with confidence.
  1. Challenges in Stock Picking: If the future is probably going to be unkind to most stocks, most stock-pickers will suffer. What worked in the past (buy a diversified portfolio, hold it for a long time, and reap the reward) will no longer work. But don’t worry, as the saying goes, “there is always a bar full of people.” We can adjust our stock-picking strategy to meet the new normal. More on this in a future post.

For more insights into market trends and investment strategies, you can explore the detailed indicators and analysis available at The Dow Theory.

By focusing on these key areas, investors can better navigate the complex and evolving financial landscape, ensuring their portfolios are well-positioned for long-term success. The happy years of buy and hold are over.

Sincerely,

Manuel Blay

Editor of thedowtheory.com


Wednesday, July 17, 2024

Gold and Silver ETF miners (GDX & SIL) soar: Primary bull market re-confirmed on 7/16/2024


Gold and Silver are also in a bull market

Overview: GDX and Sil underwent a secondary reaction against the primary bull market. Confirmed higher highs by both ETFs have reconfirmed the primary bull market.

Gold and Silver are in a bull market of their own, as I explained HERE.

I see most assets going to the roof. Are savvy speculators sensing that a wave of liquidity is going to be unleashed soon?

General Remarks:

In this post, I extensively elaborate on the rationale behind employing two alternative definitions to evaluate secondary reactions.

GLD refers to the SPDR® Gold Shares (NYSEArca: GLD®). More information about GLD can be found HERE.

SLV refers to the iShares Silver Trust (NYSEArca: SLV®). More information about SLV can be found HERE.

A) Market situation if one appraises secondary reactions not bound by the three weeks and 1/3 retracement dogma.  

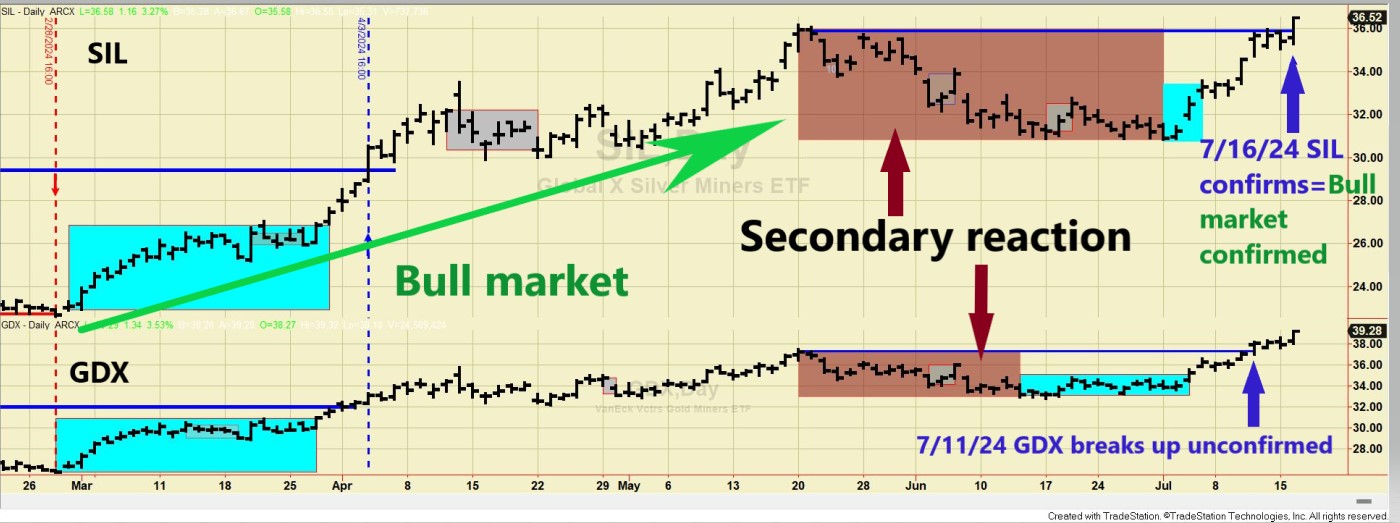
As I explained in this post, the primary trend was signaled as bullish on 4/3/24. Following the 5/20/24 highs, both ETFs dropped until 6/13/24 (GDX @33.15) and 7/1/24 (SIL @30.9). Such a drop qualified as a secondary reaction against the bullish trend.

Following such lows, a strong rally ensued. On 7/11/24, GDX broke above its 5/20/24 closing highs (@37.24). On 7/16/24, SIL confirmed by surpassing its 5/20/24 closing highs @35.93.

So, the confirmed breakup above the last recorded primary bull market highs implies that the secondary reaction against the bull market has been canceled, and the primary bull market has been reconfirmed.

The charts below illustrate recent price movements. The brown rectangles highlight the secondary reaction within the primary bear market. The small blue rectangles on the right show the initial days of a rally that set up both ETFs for a potential primary bear market signal, which ultimately did not occur. The blue horizontal lines indicate the last recorded primary bull market highs that needed to be surpassed to reconfirm the bull market. 

213 GDX and SIL bull market recofirmed July 16 EDITED

Therefore, the primary and secondary trends are now bullish.

B) Market situation if one sticks to the traditional interpretation demanding more than three weeks and 1/3 confirmed retracement to declare a secondary reaction.

In this post, I explained that the primary trend was signaled as bullish on 4/3/24.

In this instance, the long-term application of the Dow Theory coincides with the shorter-term version, so there was a secondary reaction against the primary bull market that has been successfully terminated by confirmed higher highs.

Therefore, the primary and secondary trends are now bullish.

Sincerely,

Manuel Blay

Editor of thedowtheory.com


Tuesday, July 16, 2024

Bonds at crossroads: Contradictory setups completed imply the trend is now unclear

 Once hesitation is over, the next move can be explosive.


Overview: The bond market is really at a crossroads. Depending on the timeframe applied, we got two contradictory potential signals. The shorter-term application of the Dow Theory, which I favor in cases like this as it is more reactive, completed the setup for a potential bear market, while the long-term one resulted in just the opposite: a setup for a potential bull market.

Such a gross divergence between the two timeframes is infrequent. When it occurs, it shows a market lacking direction. When the bond market finally makes its mind up, the final move can be explosive.

Fundamentally, the bond market is caught between two contradictory forces: deflation and a likely recession and the underlying inflationary pressures, which, notwithstanding the most rcent CPI print, have not subsided yet, as evidenced by a rising Producer Price Index.

So, let’s get started with the Dow Theory analysis.

General Remarks:

In this post, I extensively elaborate on the rationale behind employing two alternative definitions to evaluate secondary reactions.

TLT refers to the iShares 20+ Year Treasury Bond ETF. You can find more information about it here

IEF refers to the iShares 7-10 Year Treasury Bond ETF. You can find more information about it here.

TLT tracks longer-term US bonds, while IEF tracks intermediate-term US bonds. A bull market in bonds signifies lower interest rates, whereas a bear market in bonds indicates higher interest rates.

A) Market situation if one appraises secondary reactions not bound by the three weeks and 1/3 retracement dogma 

As I explained in this post, the primary trend shifted to bullish on 6/4/24.

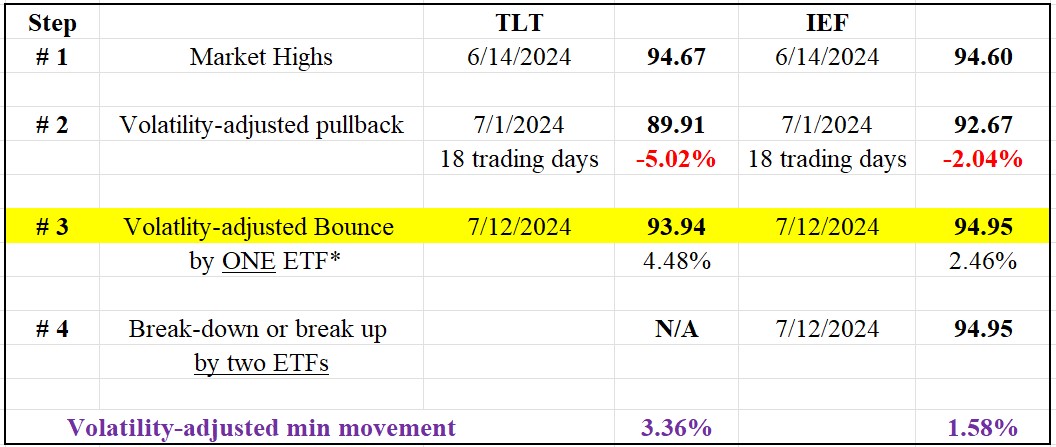
On 7/1/24, a secondary (bearish reaction) against the primary bull market was signaled. From its 6/14/24 closing highs, TLT and IEF dropped for 10 trading days, which satisfied the time requirement for a secondary reaction. The pullback also exceeded the Volatility-Adjusted Minimum Movement (VAMM, more about it here), so the extent requirement for a secondary reaction was also met.

Following the closing lows on 7/1/24, a strong rally ensued, setting up TLT and IEF for a potential primary bear market signal.

The Table below shows all the information you need:

 Table Dow Theory short term TLT IEF

 So, now we have the following options:

1) A primary bear market would be signaled if TLT and IEF jointly break below their 7/1/24 closing lows.

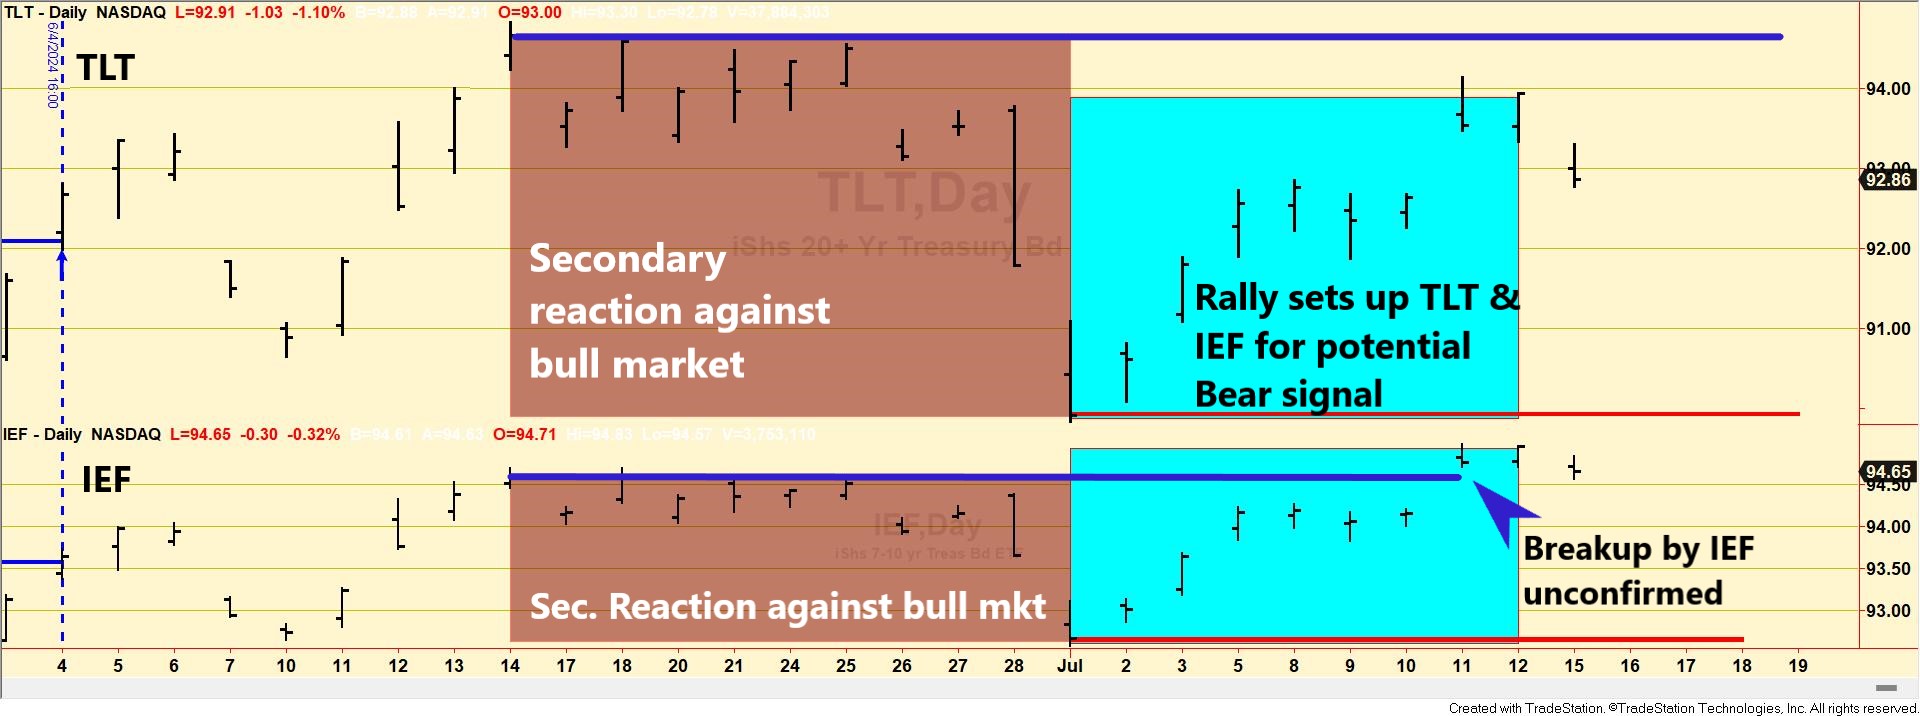
2) If TLT and IEF jointly break above their 6/14/24 bull market highs, the primary bull market would be confirmed, the secondary reaction extinguished, and the setup for a bear market signal canceled. IEF, has already surpassed its 6/14/24 highs unconfirmed by TLT. The longer it takes for TLT to confirm, the more suspect the breakup.

The charts below give you a glimpse of the current situation. The red horizontal lines highlight the 7/1/24 lows whose confirmed violation would signal a new primary bear market. The blue horizontal lines highlight the 6/14/24 bull market highs. The brown rectangles show the secondary reaction, and the blue ones show the recent rally that completed the setup for a potential primary bear market.

email subs chart TLT and IEF EDITED

 So, now the primary trend is bullish, and the secondary one is bearish.

B) Market situation if one sticks to the traditional interpretation demanding more than three weeks and 1/3 confirmed retracement to declare a secondary reaction.

As detailed in this post, the primary trend was signaled as bearish on 2/13/24.

In this post, I explained that a secondary (bullish) reaction against the bear market was in place.

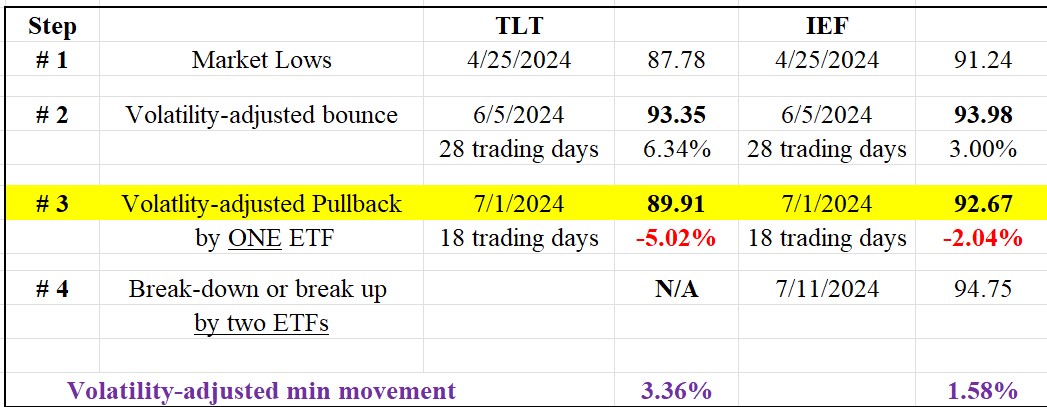
After the secondary reaction bounce, a pullback followed, setting up TLT and IEF for a potential primary bull market signal.

The Table below shows all the information you need:

Table Dow Theory LONG term TLT IEF 

The charts below give you a glimpse of the current situation. The red horizontal lines highlight the 4/25/24 lows, whose confirmed violation would confirm the primary bear market. The blue horizontal lines highlight the 6/14/24 bull highs, whose breakup would signal a new bull market. The blue rectangles show the secondary reaction, and the brown ones show the recent pullback that completed the setup for a potential primary bull market. The grey rectangles highlight a pullback that did not meet the extent requirement to complete the setup for a bull signal.

email subs chart TLT and IEF dow theory long term edited

Therefore, the primary trend is bearish, and the secondary one is bullish. 

Sincerely,

Manuel Blay

Editor of thedowtheory.com