Friday, March 14, 2025

Bull market for the gold and silver miners ETFs (GDX & SIL) signaled on 3/13/25


Overview: While most stocks are amid a severe correction, the gold and silver miners’ ETFs have shown remarkable strength, which, in my opinion, is proof that precious metals are poised for a big and sustainable run-up.

The trend for gold and silver is also bullish.

General Remarks:

In this post, I extensively elaborate on the rationale behind employing two alternative definitions to evaluate secondary reactions.

SIL refers to the Silver Miners ETF. More information about SIL can be found HERE.

GDX refers to the Gold Miners ETF. More information about GDX can be found HERE.

A) Market situation if one appraises secondary reactions not bound by the three weeks and 1/3 retracement dogma.  

As I explained in this post, the trend was signaled as bearish on 12/18/24.

As I explained here, a secondary (bullish) reaction against the bear market was signaled on 1/30/25.

And in this post, I explained that the setup for a potential primary bull market signal had been completed.

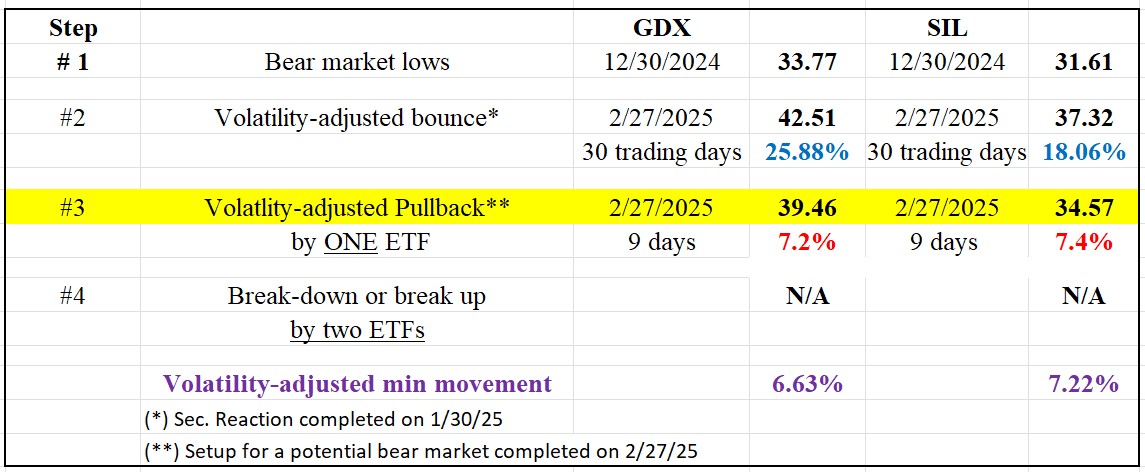
The table below contains the key prices and dates:

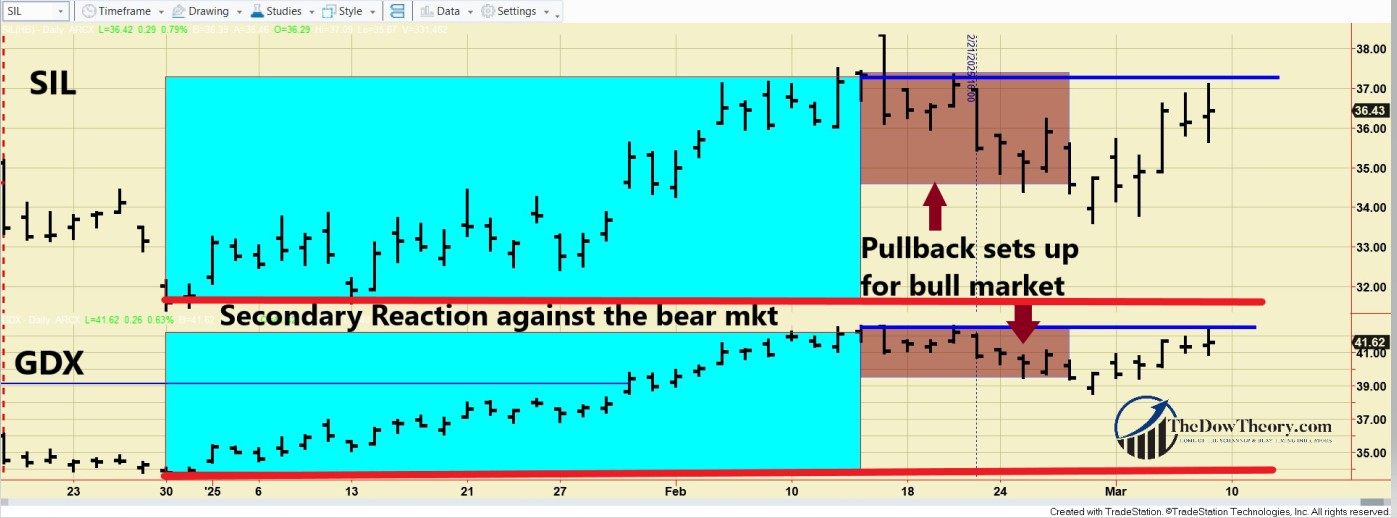
The chart below illustrates the latest price movements. The blue rectangles indicate the secondary reaction (Step #2). The brown rectangles mark the pullback (Step #3) that set up SIL and GDX for a potential primary bull market signal. The blue lines highlight the secondary reaction highs whose breakup signaled a new bull market. 


 So, now the primary and secondary trends are bullish.

B) Market situation if one sticks to the traditional interpretation demanding more than three weeks and 1/3 confirmed retracement to declare a secondary reaction.

As I explained in this post, the trend was signaled as bearish on 12/18/24.

In this instance, the long-term application of the Dow Theory coincides with the shorter-term version, so there was a secondary reaction against the primary bear market and higher highs signaled a new bull market

So, now the primary and secondary trends are bullish.

Sincerely,

Manuel Blay

Editor of thedowtheory.com


Thursday, March 13, 2025

A Fresh Look at Dow Theory for the 21st Century


Rory Guillen of Gillenmarkets.com, a long-time subscriber to our service, has just published a highly insightful article on the most recent Dow Theory for the 21st Century (DT21C) signal. You can read it HERE. The piece offers a clear and practical explanation of how to apply the DT21C, along with its strong track record of helping investors stay on course—outperforming the market while avoiding significant drawdowns.

Disclaimer: The views and opinions expressed in the article are solely those of the author and do not necessarily reflect those of TheDowTheory.com. This content is provided for general informational purposes only and should not be considered professional advice or a substitute for consultation with qualified experts.

Sincerely,

Manuel Blay

Editor of thedowtheory.com

Monday, March 10, 2025

Crypto at a Crossroads: Bitcoin’s Bear Trend, MicroStrategy’s Risk, and What Comes Next


Is the bearish trend for Bitcoin nearing its end? 

Does MicroStrategy’s aggressive Bitcoin accumulation pose a hidden risk? 

And what is the broader crypto space really trying to tell us right now?

Had an awesome time joining Alessio Rastani once again—this time diving deep into the world of Bitcoin, crypto trends, and what might be next for the digital asset market.

Huge thanks to Alessio for the thoughtful convo. If you’re watching crypto or stocks right now, this discussion is packed with insights you don’t want to miss.

🎥 Check it out here

https://youtu.be/jcfl7_speYc


Sincerely,

Manuel Blay

Editor of thedowtheory.com
Saturday, March 8, 2025

Stock Market Outlook: Key Insights from My Chat with Alessio Rastani

Had a great time joining Alessio Rastani on his YouTube channel! We covered some crucial topics, including the most immediate price action for the stock market and what to watch for in the second half of the year.

I also shared key insights on what margin debt is signaling right now—a factor that could have significant implications for market movements.

Big thanks to Alessio for having me on! If you’re following the markets closely, this is a conversation you don’t want to miss.

📺 Check it out here: 


Sincerely,

Manuel Blay

Editor of thedowtheory.com


Friday, March 7, 2025

Assessing the Bullish Setup for GDX and SIL in a Bearish Stock Environment

 The setup for a potential primary bull market in SIL and GDX was completed on 2/27/25

Overview: Despite declining stock prices, gold and silver miners’ ETFs (GDX and SIL) demonstrate resilience and completed on 2/27/25 the setup for a potential primary bull market signal.

As of this writing, neither GDX nor SIL haven broken up the relevant price levels for a new bull market.

Gold and silver themselves remain in a firmly established bull market.

Once the stock market correction concludes, I anticipate that SIL and GDX will experience an upward move, triggering the onset of a new bull market.

General Remarks:

In this post, I extensively elaborate on the rationale behind employing two alternative definitions to evaluate secondary reactions.

SIL refers to the Silver Miners ETF. More information about SIL can be found HERE.

GDX refers to the Gold Miners ETF. More information about GDX can be found HERE.

A) Market situation if one appraises secondary reactions not bound by the three weeks and 1/3 retracement dogma 

As I explained in this post, the trend was signaled as bearish on 12/18/24.

As I explained here, a secondary (bullish) reaction against the bear market was signaled on 1/30/25.

This rally stopped on 2/13/25, and a pullback followed that lasted >=2 days and exceeded the Volatility-Adjusted Minimum Movement (more about the VAMM HERE) on at least one ETF to set up GDX and SIL for a potential primary bull market signal. We don’t require confirmation When dealing with this kind of “setting up” pullback, as I explained in depth HERE.  Such a pullback set up both ETFs for a potential primary bull market signal. The Table below displays the relevant dates and prices:

278 setup bull market SIL GDX March 7 2025 table

Therefore, now we have the following options:

  1. A primary bull market will be signaled if GDX and SIL jointly surpass their 2/27/25 closing highs (Step #2 in the above table) at 42.5 (GDX) and 37.32 (SIL)
  2. If GDX and SIL continue going down and jointly break down below their 12/30/25 bear market lows, the primary bull market setup would be canceled, the secondary reaction terminated, and the primary bear market would be reaffirmed.

The charts below illustrate the latest price movements. The blue rectangles indicate the ongoing (bullish) secondary reaction amidst the prevailing primary bear market. The brown rectangles mark the present retracement. The blue horizontal lines denote the peak levels of the secondary reaction (Step #2), a breach of which would signal the start of a new primary bull market, while the red horizontal lines highlight the troughs of the bear market (Step #1), a violation of which would reinforce the bearish trend.

278 setup bull market SIL GDX March 7 2025 EDITED

B) Market situation if one sticks to the traditional interpretation demanding at least three weeks of movement to declare a secondary reaction. 

As I explained in this post, the trend was signaled as bearish on 12/18/24.

In this instance, the trend assessment using the “long-term” Dow Theory aligns with the “short-term” version. Thus, my earlier explanation applies here. The primary trend remains bearish, the secondary one is bullish, with the setup for a potential primary bull market now complete.

Sincerely,

Manuel Blay

Editor of thedowtheory.com


Thursday, March 6, 2025

The American Association of Individual Investors (AAII) Sentiment Survey: How to use it for stock market timing


A contrarian indicator


The American Association of Individual Investors (AAII) is an organization dedicated to private investors that conducts weekly sentiment surveys to gauge market expectations. Participants respond to the question: “I feel that the direction of the stock market over the next six months will be:” with one of three choices—Up (Bullish), No Change (Neutral), or Down (Bearish).

Since its inception in 1987, the survey has shown an average sentiment breakdown of 37.7% Bullish, 31.3% Neutral, and 31% Bearish. This results in an average Bullish minus Bearish Sentiment Spread of +6.7%.

Using AAII Sentiment as a Market Indicator

The AAII sentiment data, combined with other technical indicators, can be a valuable tool for identifying market tops and bottoms. Investors can identify extremes in market sentiment by analyzing the Bull-Bear Spread and applying multiples of its standard deviation.

A Bull-Bear Spread reading below its historical average minus two standard deviations is rare. When such a reading occurs, it often signals that the market is near or at a bottom.

Yes, the AAII sentiment survey is a contrarian indicator. When individual investors are overwhelmingly bullish, it often serves as a sell signal, as historically, retail investors tend to be wrong at extremes. Conversely, when they are extremely bearish, it typically signals a buying opportunity—again, because they are usually wrong at these extremes.

Historical Precedents of Extreme Negative Sentiment

On February 25, 2025, the Bull-Bear Spread plunged to -41.2%, which is 2.6 standard deviations below its historical average—an extreme move. Since June 1987, sentiment has reached such depressed levels only three times.

1990 Bear Market Recovery

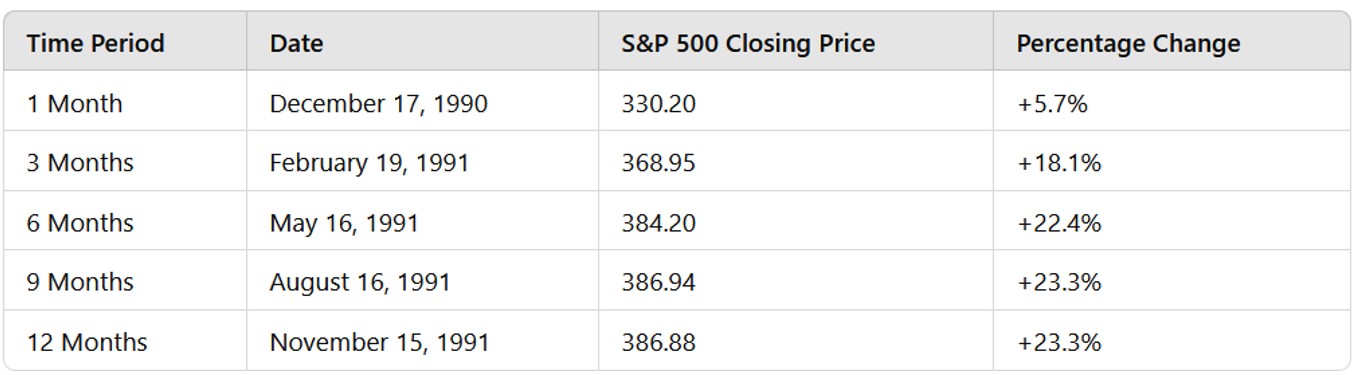
In 1990, there was a cluster where the Bull-Bear Spread remained below -41.2% for four weeks from late September to mid-November. During this period, the market remained near its lows, but when it rebounded in November, it launched a significant and sustained rally, as shown in the table below:

table AAII performance 1990

2009: The Great Recession Lows

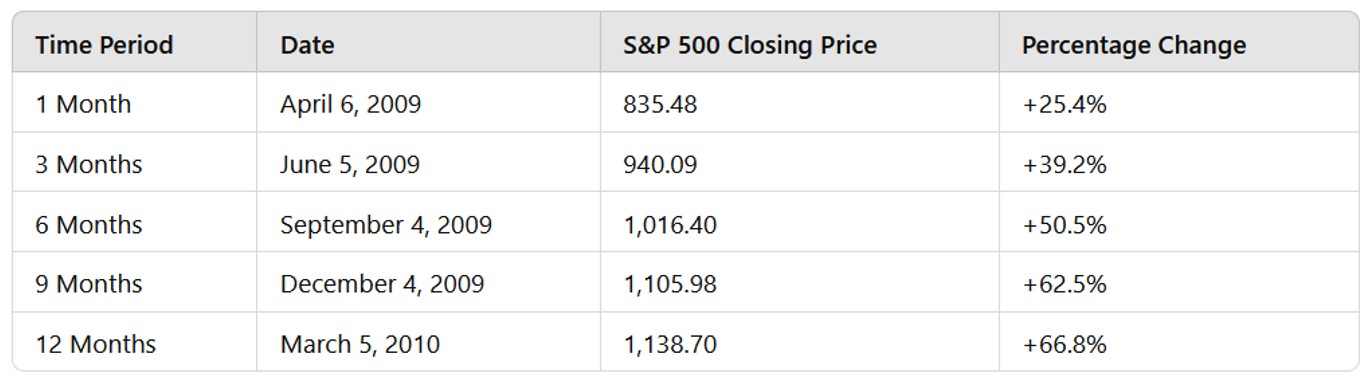
On March 5, 2009, at the depths of the Great Recession bear market, the Bull-Bear Spread fell to -51.4%. Following this extreme bearish sentiment, the S&P 500 staged an impressive recovery, as illustrated in the table below.

table AAII performance 2009

2022: A Premature Sentiment Signal

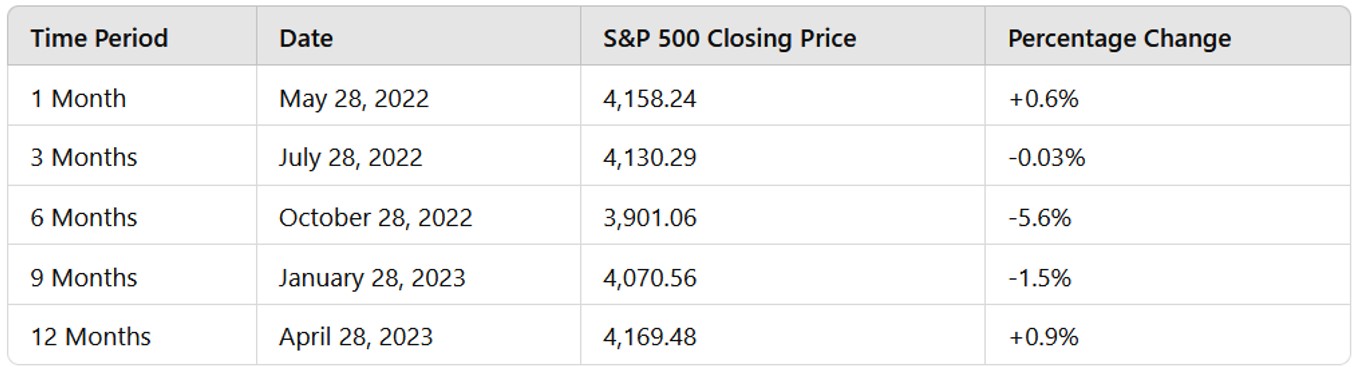
More recently, in 2022, a similar cluster occurred, with the Bull-Bear Spread remaining below -41.2% for four weeks from April 28, 2022, to September 22, 2022. However, unlike in 1990 and 2009, this extreme bearish sentiment did not coincide perfectly with the market bottom. The S&P 500’s performance one year after these sentiment extremes was underwhelming. Nevertheless, the data suggests that by the time sentiment reached such negative levels, the downside risk in the market had already been largely exhausted, as you can see in the table below:

table AAII performance 2022

Key Takeaways

The 2022 episode highlights that extreme negative sentiment does not always pinpoint an immediate market bottom, nor does it guarantee a strong rally. However, history suggests that such levels of pessimism generally precede better-than-average S&P 500 performance.

More importantly, when AAII sentiment reaches extreme bearish readings, significant further declines in the S&P 500 become increasingly unlikely.

So what are the implications of the most recent reading? Subscribe to our Letter and you’ll see a vital chart and the specific forecast given the current situation which I show in the March 1st 2025 Letter.

Sincerely,

Manuel Blay

Editor of thedowtheory.com