Wednesday, June 17, 2026

Some Lessons I Have Learned as a Quantitative Trader


Outperformance Comes in Bursts, Pain Comes in Stretches

What follows is based on my own experience as a quantitative trader. Other quants, using different models, different universes, or different constraints, may have reached different conclusions.

One of the first lessons I have learned is the importance of understanding the universe one is trading. I run one specific strategy focused on S&P 500 constituents, but most of my other strategies also include mid- and small-caps. I generally avoid microcaps because their low liquidity often makes backtests unrealistic and live trading difficult. It is very easy to produce extraordinary historical returns in illiquid stocks that cannot be replicated in the real world.

Even when I focus on relatively liquid small- and mid-caps with strong ranking profiles, the experience can be psychologically demanding. By ranking profile, I mean the relative attractiveness of a stock based on factors such as financial strength, business quality, growth, value, momentum, or a combination of several of these. In theory, a portfolio of highly ranked stocks should do well. In practice, the journey is rarely smooth.

What I have observed is that small and mid-caps often underperform the S&P 500 for extended periods. This can happen even when the strategy is fundamentally sound and has a strong long-term record. Over a two-year period, and often even over one year, my quantitative strategies have usually outperformed the S&P 500. But that outperformance does not usually come in a steady, comfortable way.

Instead, it often comes in bursts.

This is one of the most important lessons. A strategy may lag badly for months. You may see the S&P 500 rise 10% in five months while your own strategy is flat. That is not easy to endure. It feels as if something is wrong. It creates doubt. It tests your confidence in the model.

Then, suddenly, in a period of only six or eight weeks, the same strategy may gain 25% and leave the S&P 500 far behind. The brief burst of outperformance more than compensates for the long and frustrating period of underperformance.

This is why there is no free lunch. Quantitative strategies may deliver superior long-term results, but they demand psychological fortitude. It is not enough to have a good model. One must also have the temperament to stick with it when it is temporarily out of favor.

The screenshots below illustrate this point clearly. The first chart displays the periods of underperformance (in red) and outperformance (in green) of one of my quant-based trading strategies relative to a simple S&P 500 buy-and-hold approach.
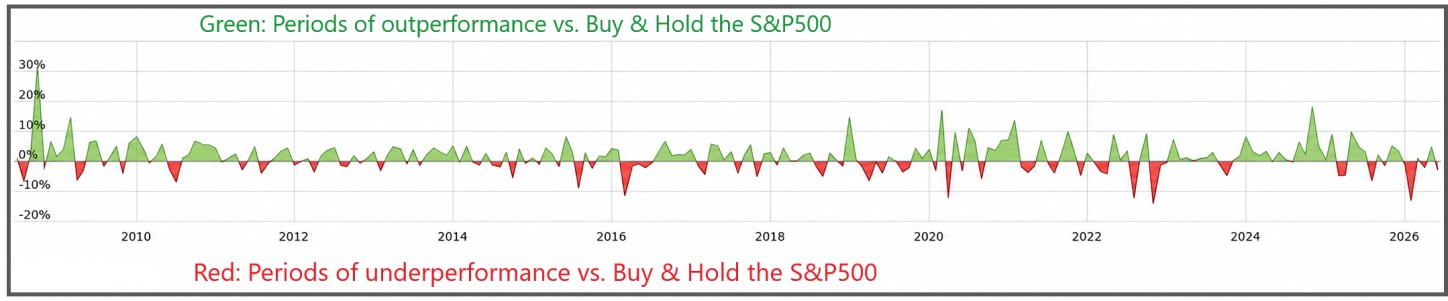
405 periods of underperformance and outperformance vs buy and hold

What matters is not merely the final result. What matters is the path taken to get there. And the road may feel uncomfortable.

You can observe several spells of underperformance. In hindsight, they look tolerable. In real time, they are painful. They test your patience because you do not know whether the strategy is merely going through a normal bad stretch or whether something has genuinely stopped working.

However, if we look back over two years, the picture changes completely, as shown in this chart:
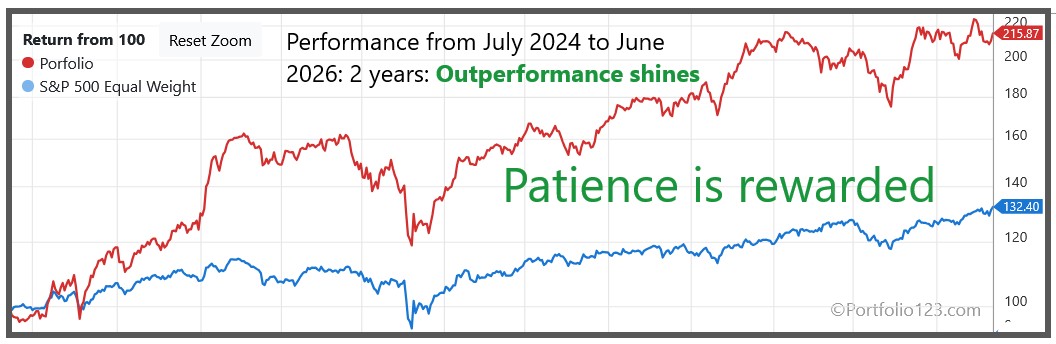
406 periods of underperformance and outperformance vs buy and hold 2 years chart

The same strategy becomes a strong outperformer. And if we extend the view to almost 20 years, its long-term outperformance relative to the S&P 500 becomes even clearer.

Importantly, these results are not based on a frictionless theoretical exercise. A substantial slippage assumption of 0.25% per side of each trade has been included. That matters because, especially when trading smaller and mid-sized companies, ignoring slippage can make a strategy look much better on paper than it would have been in the real world.

The key takeaway is simple: patience is essential. The more your portfolio differs from the S&P 500, especially if it includes smaller companies, the more likely you are to underperform the index for extended periods. Your edge may not show up every month, or even every quarter. Often, it appears in short, powerful bursts that more than offset the painful spells of relative weakness.

That is the price of outperformance, and it is a price that can only be paid by those with the patience and psychological fortitude to stay the course when the going gets tough. In the end, that is often what separates the winners from the losers.

Sincerely,

Manuel Blay

Editor of thedowtheory.com

Wednesday, June 10, 2026

Gold and Silver miners ETFs Turn Bearish on 6/9/2026


Overview: In my June 1st Letter to subscribers, I noted that the two-year Treasury yield was breaking higher and that this would likely exert a negative influence on liquidity.

One of the main casualties appears to have been the gold and silver miners. On 6/9/26, a new bear market was signaled in both GDX and SIL. Gold and silver themselves have also been affected, as I discussed in this post.

Stocks, by contrast, have been affected only modestly so far. The decline has not even been enough to turn the secondary trend bearish. Therefore, both the primary and secondary trends for stocks remain bullish.

General Remarks:

In this post, I elaborate extensively on the rationale behind employing two alternative definitions to evaluate secondary reactions.

SIL refers to the Silver Miners ETF. More information about SIL can be found HERE.

GDX refers to the Gold Miners ETF. More information about GDX can be found HERE.

A) Market situation if one appraises secondary reactions not bound by the three weeks and 1/3 retracement dogma.  

As I explained in this post, the trend was signaled as bullish on 6/2/25.

Following a pullback (secondary reaction against the bullish trend), both GDX and SIL experienced a bounce, setting up both ETFs for a potential primary bear market signal. You can find detailed explanations and charts HERE.

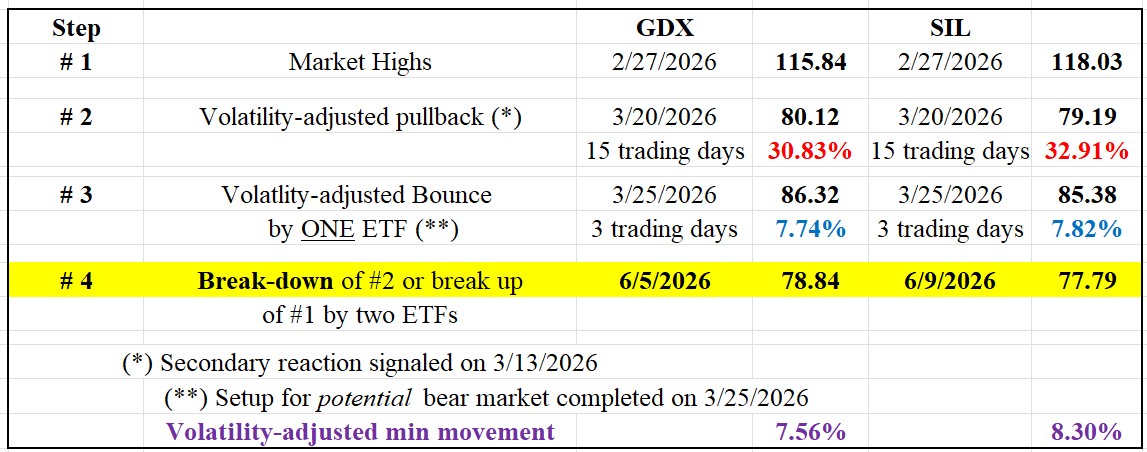
The table below gives you all the relevant information:

403 SIL GDX BEAR MKT JUNE 9 2026 TABLE

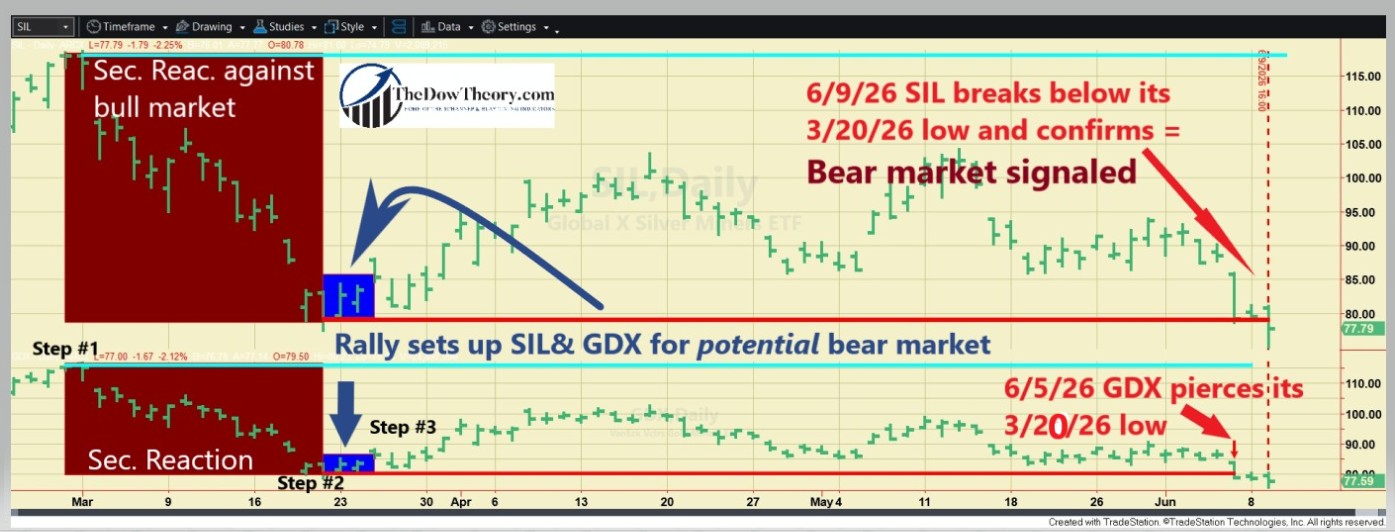
On 6/5/26, GDX broke down below its 3/20/26 pullback lows (Step #2). On 6/9/26, SIL confirmed by piercing its 3/20/26 closing lows. Since it was a confirmed violation, a primary bear market was signaled according to the Dow Theory.

Check out the chart below for a visual walkthrough of the recent price action. The brown rectangles highlight the secondary reaction (Step #2), the blue rectangles show the rally (Step #3) originating from the secondary reaction lows that set up both ETFs for a potential bear market signal, and the red horizontal lines pinpoint the pullback lows whose joint violation signaled the new bear market. The blue horizontal lines highlight the last recorded primary bull market highs (Step #1), whose upside breakout would signal a new primary bull market.

403 SIL GDX BEAR MKT JUNE 9 2026 edited 1


Thus, both the primary and secondary trends are currently bearish.

B) Market situation if one sticks to the traditional interpretation demanding more than three weeks and 1/3 confirmed retracement to declare a secondary reaction.

As I explained in this post, the trend was signaled as bullish on 6/2/25.

In this instance, the long-term application of the Dow Theory coincides with the shorter-term version, so there was a secondary reaction against the primary bull market, and the setup for a potential bear market signal has been completed. The confirmed violation of the 3/20/26 secondary reaction low triggered a bear market signal.

Thus, both the primary and secondary trends are currently bearish.

Sincerely,
Manuel Blay

Editor of thedowtheory.com
 

Tuesday, June 9, 2026

After a Long Ride, Gold and Silver Turn Bearish on 6/9/2026


Overview: In my June 1st Letter to subscribers, I noted that the two-year Treasury yield was breaking higher and that this would likely exert a negative influence on liquidity.

One of the main casualties appears to have been gold and silver. Today, 6/9/26, a new bear market was signaled in both metals. Gold and silver miners have also been hit, and I will address them in a separate post.

Stocks, by contrast, have been affected only modestly so far. The decline has not even been enough to turn the secondary trend bearish. Therefore, both the primary and secondary trends for stocks remain bullish.

General Remarks:

In this post, I extensively elaborate on the rationale behind employing two alternative definitions to evaluate secondary reactions.

GLD refers to the SPDR® Gold Shares (NYSEArca: GLD®). More information about GLD can be found HERE.

SLV refers to the iShares Silver Trust (NYSEArca: SLV®). More information about SLV can be found HERE.

A) Market situation if one appraises secondary reactions not bound by the three weeks and 1/3 retracement dogma.  

As I explained in this post, the primary trend was signaled as bullish on 4/2/24.

Following a pullback (secondary reaction against the bullish trend), both GLD and SLV experienced a bounce, setting up both ETFs for a potential primary bear market. You can find detailed explanations and charts HERE.

The table below gives you all the relevant information:

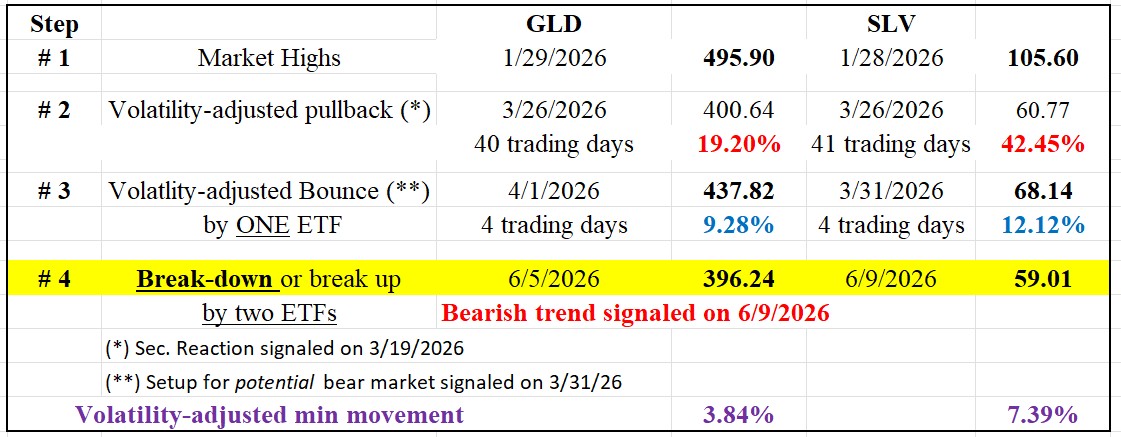
402 Table GLD SLV BEAR MARKET JUNE 9 2026

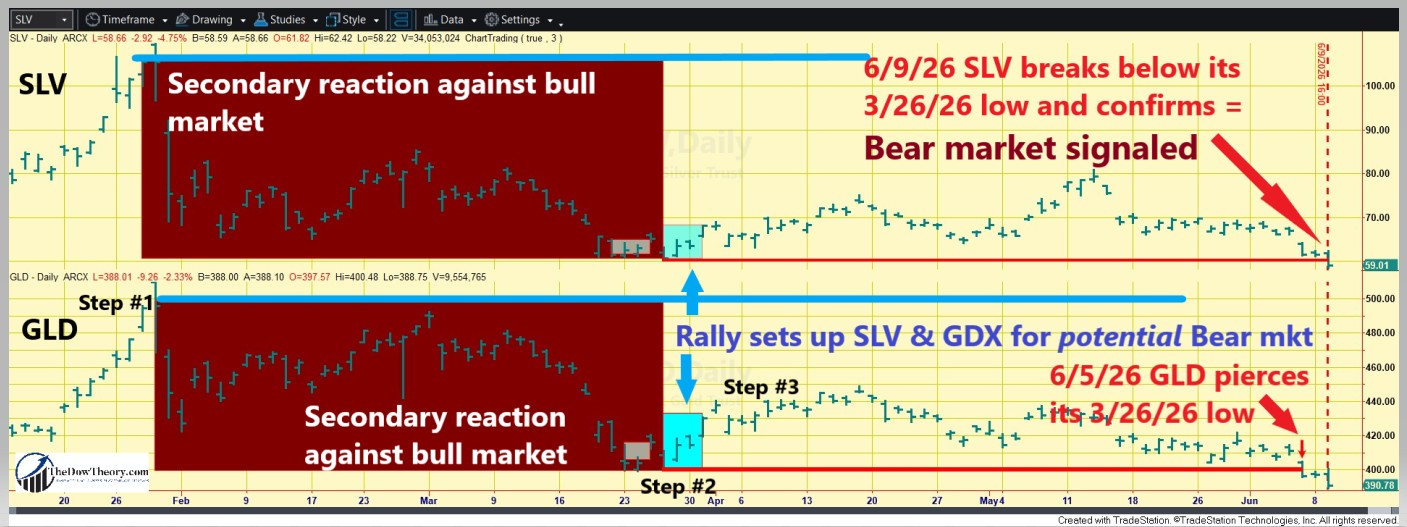
On 6/5/26, GLD broke down below its 3/26/26 pullback lows (Step #2). On 6/9/26, SLV confirmed by piercing its 3/26/26 closing lows. Since it was a confirmed violation, a primary bear market was signaled according to the Dow Theory.

Check out the chart below for a visual walkthrough of the recent price action. The brown rectangles highlight the secondary reaction (Step #2), the blue rectangles show the rally (Step #3) originating from the secondary reaction lows that set up both ETFs for a potential bear market signal, and the red horizontal lines pinpoint the pullback lows whose joint violation signaled the new “bear market.” The blue horizontal lines highlight the last recorded primary bull market highs (Step #1), whose upside breakout would signal a new primary bull market.

402 SLV GLD BEAR MARKET JUNE 9 2026 edited

Thus, both the primary and secondary trends are currently bearish.

B) Market situation if one sticks to the traditional interpretation demanding more than three weeks and 1/3 confirmed retracement to declare a secondary reaction.

As I explained in this post, the primary trend was signaled as bullish on 4/2/24.

In this instance, the long-term application of the Dow Theory coincides with the shorter-term version, so there was a secondary reaction against the primary bull market, and the setup for a potential bear market signal has been completed. The confirmed violation of the 3/26/26 secondary reaction low triggered a bear market signal.

Thus, both the primary and secondary trends are currently bearish.

Sincerely,
Manuel Blay

Editor of thedowtheory.com
Tuesday, June 2, 2026

Earnings Beat Valuations: Why the U.S. Still Leads


Do Not Underestimate America’s Earnings Machine

Do you remember when, just a few months ago, many experts insisted that U.S. stocks were too expensive, while Europe, and even China, offered the real value?

I never bought into that thesis.

At the time, I wrote several posts (here, here, here and here) warning that so-called “cheap” markets can easily become value traps. Low valuations alone are not enough. A market may look inexpensive for a reason, especially when earnings growth, innovation, capital allocation, and structural competitiveness are lacking.

That is why I was never persuaded by the simplistic argument that “Europe is cheap and the U.S. is expensive.” Cheapness is not a strategy. Earnings are.

Now Bloomberg (reproduced here without a paywall) seems to be reaching a similar conclusion. As Bloomberg reported:

I don’t think I remember a time that sell side consensus missed actual earnings number by so much,” said Charles Henry Monchau, chief investment officer at Banque Syz & Co SA. He began the year positioned for international markets to outperform, but the war and AI boom prompted him to tactically shift back toward US stocks, noting that regions such as China and Europe “might not be the winners of this war (emphasis supplied).”

The lesson is clear.

Do not blindly trust consensus. Do not blindly trust the experts. And above all, do not underestimate the United States.

In the end, earnings matter. And unless something changes drastically, the U.S. remains the undisputed leader in earnings generation. Energy independence, relentless innovation, a flexible labor market, relatively lower taxation and lighter regulation, and, whether some like it or not, unmatched military strength all reinforce America’s ability to create, scale, and protect profit generating businesses. Valuation arguments may sound persuasive in theory, but markets ultimately reward companies and economies that deliver profits, innovation, and growth.

The chart below shows the whole story:

Article content

Sincerely,

Manuel Blay

Editor of thedowtheory.com