GOLD AND SILVER
A) Market situation if one appraises secondary reactions not bound by the three weeks dogma.
As I
explained here, the primary and secondary trend was signaled as
bearish on 6/30/22.
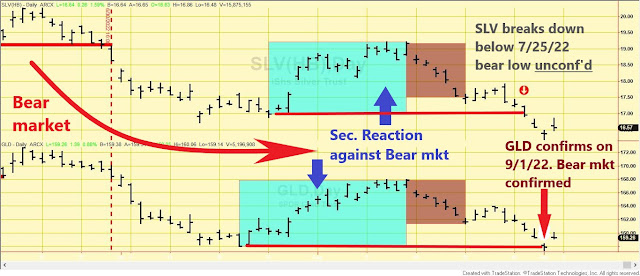
Following the 7/20/22 closing lows for GLD and 7/25/2022 for SLV, a secondary (bullish) reaction against the primary bear market developed. After that, a pullback ensued, setting up both metals for a potential primary bull market signal. You may find the in-depth explanation here.
On 8/30/22, SLV broke downside its 7/25 bear market lows. On 9/1/22, GLD broke down below its 7/20 bear low and confirmed SLV. Accordingly:
1) The setup for a potential primary bull market (brownish rectangle on the charts below) was canceled.
2) The secondary reaction was terminated.
3) The primary bear market has been reconfirmed.
The Table below shows all the price action that led to the reconfirmation of the primary bear market.
Below
you have the updated charts. The blue rectangles show the secondary (bullish)
reaction against the bear market. The brownish rectangles display the pullback
that set up GLD and SLV for a potential bull market signal. The red horizontal lines
highlight the primary bear market lows that have been broken down.
B) Market situation if one sticks to the traditional interpretation demanding at least three weeks of movement to declare a secondary reaction.
As I explained here, the primary and secondary trend was signaled as bearish on 6/30/22.
The rally that started off the 7/20/22 closing lows for GLD and 7/25/2022 for SLV did not reach at least 15 trading days on both ETFs, so we cannot talk of a secondary reaction. Therefore, the primary and secondary trends remain bearish.
Sincerely,
Manuel Blay
Editor of thedowtheory.com


Manuel,
ReplyDeleteThank you for your response to my recent comment on your September 5th posting. I believe I understand perfectly your VAMM calculation, but I cannot duplicate in Excel the exact results you get. For instance, you show the GDX VAMM for 09/02/22 as 5.93% but my calculation is 5.56%. Very close, the difference is immaterial and the reason may be slight differences in the prices from our data source.
I have spent a good many hours the past few days exploring in depth the concept of VAMM, considering alternative ways of measuring volatility, and assessing what would be an optimum look-back period to use for its calculation.
I would appreciate your thoughts on an observation (which developed into a conclusion) that became apparent during my efforts.
I believe using a 30-day average to determine volatility is too short a time frame. I like to use Fibonacci numbers for financial analysis parameters, so I computed VAMM’s using 30, 89, and 144 day averages on lots of different dates for the gold and bond ETF’s used on your blog. In all cases, I also computed the VAMM for each of the 10 trading days prior to the date in question. I found that there was a significant variance in VAMM’s among the 10 days using a 30 day average. For instance, TLT on 08/25/22, I calculated VAMM as 3.065%, but differing results during the 10 days prior ranged from a 3.656% to 3.065%, an almost 20% difference. Similar results were obtained in the majority of my 30 day testing. However, using an 89 day average significantly reduced the fluctuation to about 3% and this was further reduced using a 144 day average to around 2%.
My interpretation of this is that the VAMM result from a 30 day average volatility is subject to too much randomness (potential variance) and not an ideal standard to be set as a firm reference point for Dow Theory decision making. A longer look-back period seems to provide a better guideline on which to base the all-important buy, sell, and confirmation signals.
Unlike basic Dow Theory, which has a fixed 3% extent requirement, new VAMM’s need to be derived every time a secondary reaction comes into play. I believe it is important to eliminate as much as possible any haphazard aspect in connection with recurring VAMM’s, and that using longer reference periods for this calculation would be the best way to do that.
I am not a math whiz nor a gifted financial analyst, but I hope this examination of one component related to price volatility is worthy of consideration and a possible response, even if it involves pointing out shortcomings in my thinking.
Russell Cowgill
If you read my answer (8/26/22 post) carefully, I talked of taking 100 to 1000 days of daily price changes (close to close). Not 30 days. The VAMM figures I provide on this blog are based on a 1000 tradings days average to avoid fluctuations, and it has worked fine with me. I hope this helps. Best regards
ReplyDelete