General Remarks:
In this post, I extensively elaborate on the rationale behind employing two alternative definitions to evaluate secondary reactions.
TLT refers to the iShares 20+ Year Treasury Bond ETF. You can find more information about it here.
IEF refers to the iShares 7-10 Year Treasury Bond ETF. You can find more information about it here.
TLT tracks longer-term US bonds, while IEF tracks intermediate-term US bonds. A bull market in bonds signifies lower interest rates, whereas a bear market in bonds indicates higher interest rates.
A) Market situation if one appraises secondary reactions not bound by the three weeks and 1/3 retracement dogma
As I explained in this post, the trend was signaled as bearish on 5/19/26.
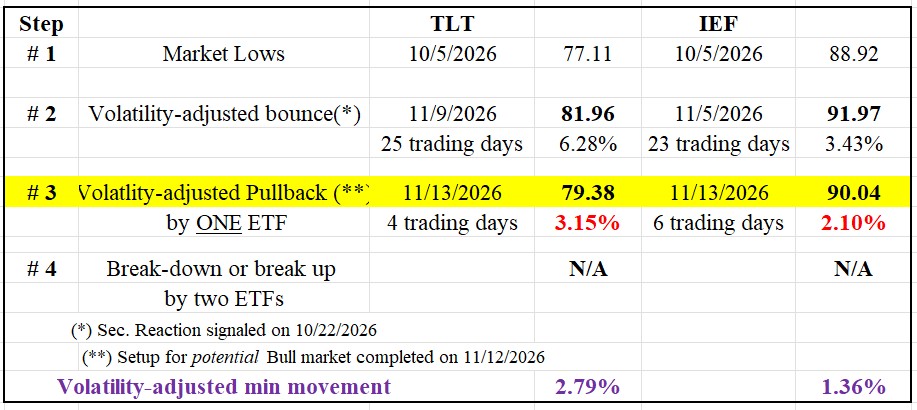
The rally that started off the 10/5/26 lows qualifies as a secondary reaction (Step #2 in the table below). This rally stopped on 11/9/26 for TLT and 11/5/26 for IEF.
A pullback followed that lasted >=2 days and exceeded the Volatility-Adjusted Minimum Movement (more about the VAMM HERE) on at least one ETF to set up TLT and IEF for a potential primary bull market signal. Such a pullback set up both ETFs for a potential primary bull market signal.
The Table below displays the relevant dates and prices:
Therefore, now we have the following options:
- A primary bull market will be signaled if TLT and IEF jointly surpass their 11/9/26 and 11/5/26 closing highs, respectively (Step #2 in the above table), at 81.96 (TLT) and 91.97 (IEF).
- If TLT and IEF continue to decline and jointly break below their 10/5/26 bear market lows, the primary bull market setup will be canceled, the secondary reaction will be terminated, and the primary bear market will be reaffirmed.
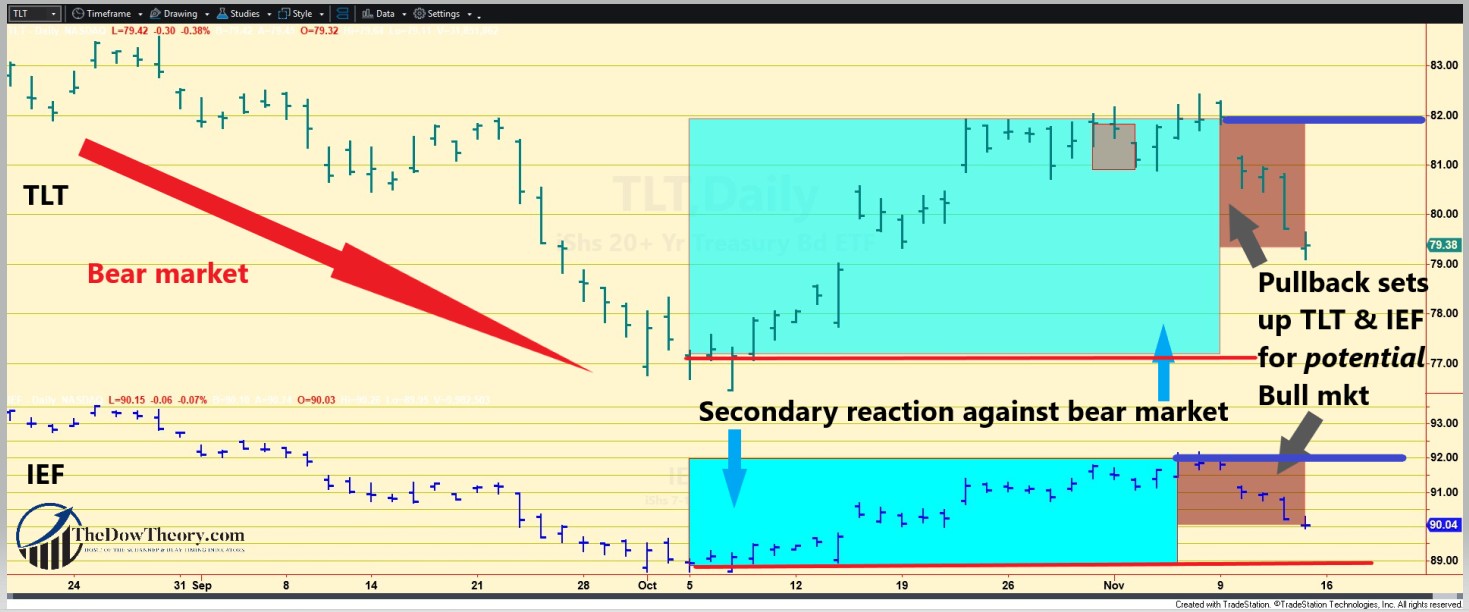
The charts below illustrate the latest price movements. The greenish rectangles indicate the ongoing (bullish) secondary reaction amidst the prevailing primary bear market. The brown rectangles mark the present retracement. The blue horizontal lines denote the peak levels of the secondary reaction (Step #2), a breach of which would signal the start of a new primary bull market, while the red horizontal lines highlight the troughs of the bear market (Step #1), a violation of which would reinforce the bearish trend. The gray triangles display a pullback that lacked enough extent to set up TLT and IEF for a bull market signal.
B) Market situation if one sticks to the traditional interpretation demanding at least three weeks of movement to declare a secondary reaction.
As I explained in this post, the trend was signaled as bearish on 5/19/26.
In this instance, the trend assessment using the “long-term” Dow Theory aligns with the “short-term” version. Thus, my earlier explanation applies here. The primary trend remains bearish, the secondary one is bullish, with the setup for a potential primary bull market now complete.
Sincerely,
Manuel Blay
Editor of thedowtheory.com

No comments:
Post a Comment