Breaking Down Gold and Silver: A Critical Moment
Overview: In a similar fashion to the gold and Silver miner’s ETFs, gold and silver reached a make-or-break moment on 20/19/24. The setup for a potential bear market has been completed, and the line on the sand has been drawn.
In this post, we examine the key prices to observe that would signal a new primary bear market.
General Remarks:
In this post, I extensively elaborate on the rationale behind employing two alternative definitions to evaluate secondary reactions.
GLD refers to the SPDR® Gold Shares (NYSEArca: GLD®). More information about GLD can be found HERE.
SLV refers to the iShares SLVver Trust (NYSEArca: SLV®). More information about SLV can be found HERE
A) Market situation if one appraises secondary reactions not bound by the three weeks and 1/3 retracement dogma.
As I explained in this post, the primary trend was signaled as bullish on 4/3/24.
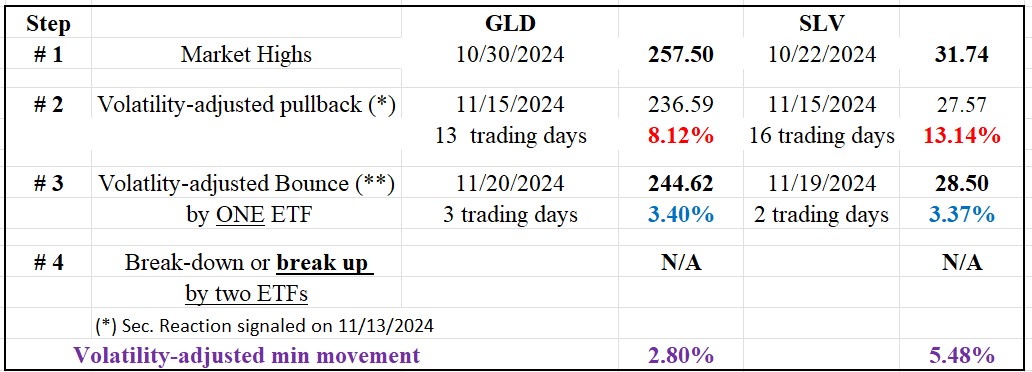
Following the 10/22/24 (SLV) and 10/30/24 (GLD) highs, there was a pullback until 11/15/24. Such a pullback meets the time and extent requirement for a secondary (bearish) reaction against the still-existing primary bull market.
The rally that started off the 11/15/24 lows until 11/19/24 (SLV) and 11/20/24 (GLD) set up both ETFs for a potential primary bear market signal. Thus, a confirmed breakdown of the 11/15/24 (SLV at 27.57 and GLD at 236.59) would signal a new primary bear market.
Please remember that we don’t require confirmation for the final rally that completes a bear (or bull) signal setup. More information is in this post.
The table below gives you the most relevant information:

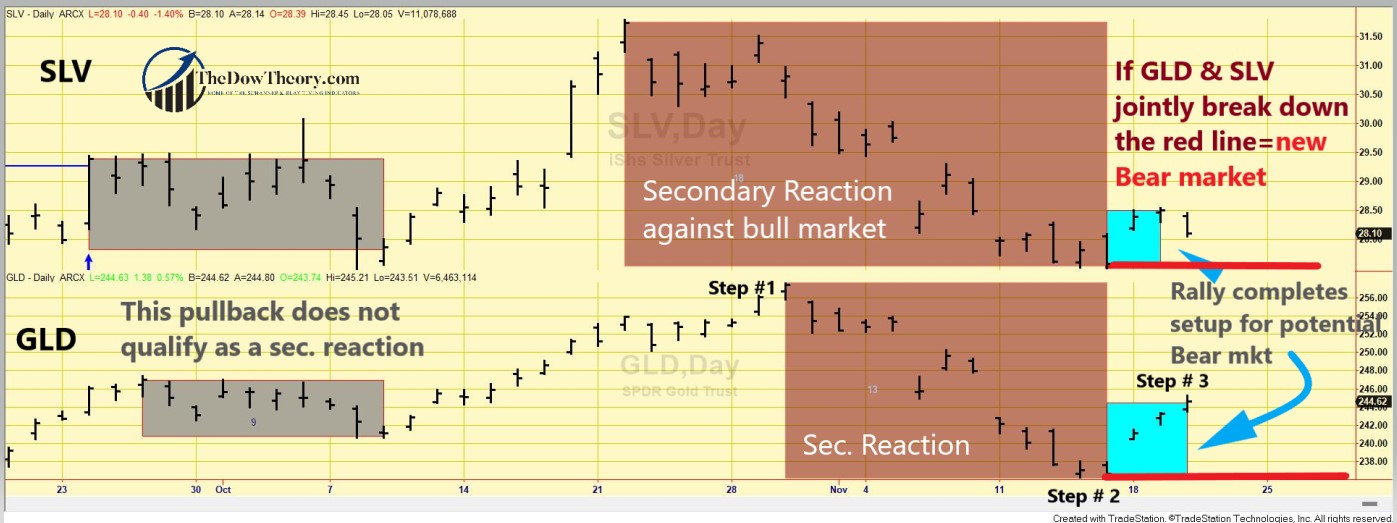
The chart below illustrates the latest price movements. The brown rectangles mark the secondary reaction against the primary bull market (Step #2). The blue rectangles indicate the rally (Step #3), positioning GLD and SLV for a potential bear market signal. The red horizontal lines show the secondary reaction lows (Step #2), where a confirmed break would signal a new primary bear market. The grey rectangles display a minor pullback that did not qualify as a secondary reaction.

So, now we have two options:
- If GLD and SLV jointly break down their 11/15/24 (SLV at 27.57) and 11/15/24 (GLD at 236.59) lows, a new primary bear market would be signaled.
- If GLD and SLV jointly surpass their 10/22/24 (SLV) and 10/30/24 (GLD) highs, the primary bull market would be reconfirmed, and the secondary reaction and bearish setup would be canceled.
So, now, the primary trend is bullish, and the secondary one is bearish.
B) Market situation if one sticks to the traditional interpretation demanding more than three weeks and 1/3 confirmed retracement to declare a secondary reaction.
I explained in this post that the primary trend was signaled as bullish on 4/2/24.
The current pullback did not reach 15 confirmed days by both ETFs, so there is no secondary reaction against the bull market.
So, the primary and secondary trends are bullish under the “slower” appraisal of the Dow Theory.
Sincerely,
Manuel Blay
Editor of thedowtheory.com
No comments:
Post a Comment