Gold and Silver trends unchanged
It’s been a while without posting about precious
metals and their miners, given that there was no news on the technical front. As
for gold and silver, I plan to post soon. In the meantime, their trends have
not changed. Here is my latest update for GLD and SLV.
GOLD AND SILVER MINERS ETFs
A) Market situation if one appraises secondary reactions not bound by the three weeks dogma.
As I explained here, the primary trend was signaled as bearish on 6/23/22.
The secondary trend was signaled as bearish on 8/30/22, as explained here.
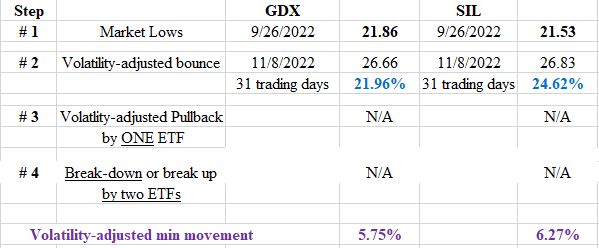
Following the 9/26/22 lows, there has been a rally that finally met the time requirement for a secondary reaction (at least 10 trading days, under normal volatility) on 11/8/22. As to the extent requirement, it has been more than met. The Table below contains the relevant information concerning the current secondary reaction against the primary bear market:
Now we are faced with three possible outcomes:
a) We get a pullback of at least 2 trading days and exceeding the Volatility-Adjusted Minimum Movement (VAMM, more about it here), in which case the setup for a new primary bull market would be completed.
b) If we don’t get such a pullback, and both ETFs continue going higher, breaking above the closing highs of the last completed secondary reaction (8/10/22 @27.13 for SIL and 8/12/22 @27.22 for GDX, a primary bull market would also be signaled. This is an alternative signal which has been thoroughly discussed in the past (examples HERE & HERE)
c) If both ETFs plunged below 9/26/22 closing lows, the primary bear market would be reconfirmed, and the current secondary reaction would be terminated.
The charts below help you visualize the current situation. The blue horizontal lines highlight the highs of the last completed secondary reaction (letter “b” above). Their confirmed breakup would signal a new primary bull market. The charts' blue rectangles on the right show the current secondary reaction. The grey rectangles show a rally that did not meet the time requirement to qualify as a secondary reaction which we disregard for technical purposes.

B) Market situation if one sticks to the traditional interpretation demanding at least three weeks of movement to declare a secondary reaction.
The primary trend was signaled as bearish on 8/9/2021, as was explained here.
Lower lows on 9/26/22 reaffirmed the primary bear market and confirmed the secondary trend as bearish.
Following the 9/26/22 lows, there has been a rally that finally met the time requirement for a secondary reaction (at least 15 trading days) on 11/8/22. As to the extent requirement, it has been more than met. The Table below contains the relevant information concerning the current secondary reaction against the primary bear market:

Now we are faced with three possible outcomes:
a) We get a confirmed pullback of at least 2 trading days and exceeding the Volatility-Adjusted Minimum Movement (VAMM, more about it here), in which case the setup for a new primary bull market would be completed.
b) If we don’t get such a pullback, and both ETFs continue going higher, breaking above the closing highs of the last completed secondary reaction (4/13/22 @39.54 for SIL and 4/18/22 @40.87 for GDX), a primary bull market would also be signaled. This is an alternative signal which has been thoroughly discussed in the past (example HERE & HERE)
c) If both ETFs plunged below 9/26/22 closing lows, the primary bear market would be reconfirmed, and the current secondary reaction would be terminated.
The charts below help you visualize the current
situation. The blue horizontal lines highlight the highs of the last completed
secondary reaction (letter “b” above). Their confirmed breakup would signal a
new primary bull market. The charts' blue rectangles on the right show the
current secondary reaction. The grey rectangles show a rally that did not meet
the time requirement to qualify as a secondary reaction which we
disregard for technical purposes. The red horizontal lines display the last
recorded primary bear market lows whose confirm breakdown would cancel the
current secondary reaction and reaffirm the primary bear market.

No comments:
Post a Comment