This signal pertains to the long-term version of the Dow Theory
EXECUTIVE SUMMARY:
1. As a reminder, gold and silver have been in a primary bull market since 12/1/22, as I explained HERE.
2. The shorter-term appraisal of the trend for SIL and GDX has been bullish since 11/10/22, as I explained HERE.
3. Since 1/4/23, the long-term appraisal of the trend is bullish for SIL and GDX too.
4. Confirmation across markets (gold and silver) and time frames is bullish.
5. The break-up of the 12/1/22 (GDX) and 12/2/22 (SIL) closing highs is a bullish development.
General Remarks:
In this post, I provided a thorough explanation concerning the rationale behind my
use of two alternative definitions to appraise secondary reactions.
GOLD AND SILVER MINERS ETFs
A) Market situation if one appraises secondary reactions not bound by the three weeks dogma.
I explained HERE that the primary trend was signaled as bullish on 11/10/22.
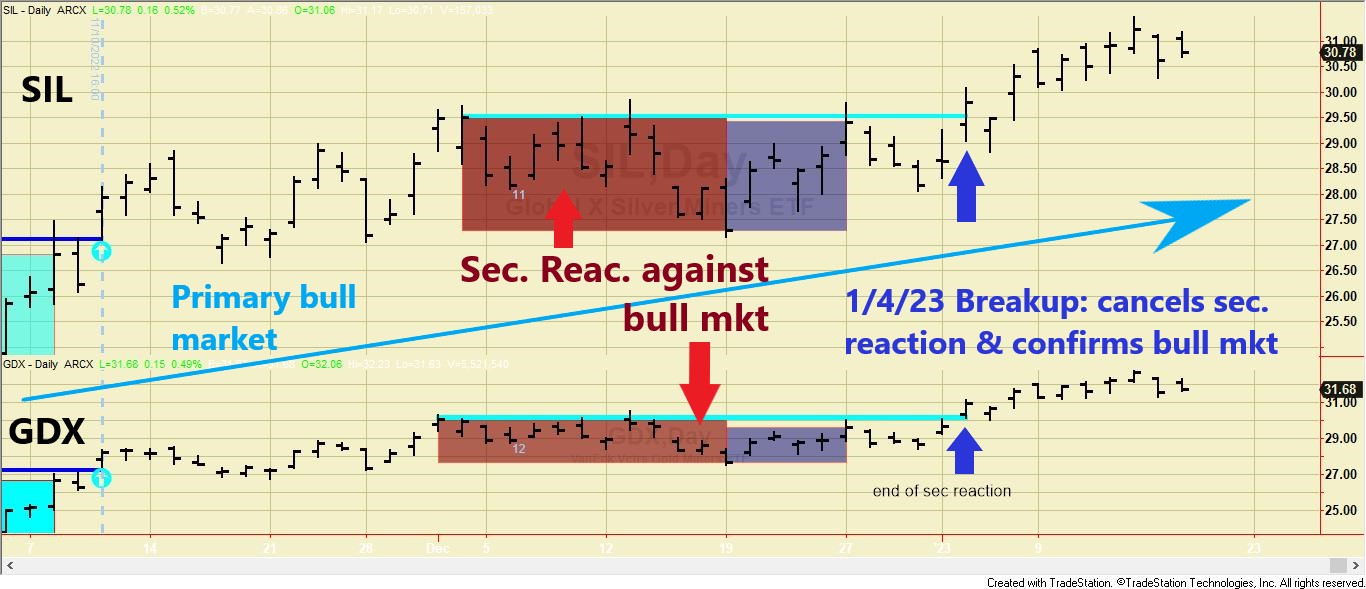
Here, I explained the development of a secondary reaction against the bullish trend. On 1/4/23, GDX and SIL broke topside their respective 12/1/22 and 12/2/22 closing highs. Higher confirmed highs canceled the secondary reaction and confirmed the primary bull market. Higher highs also canceled the setup for a potential primary bear market signal.
Accordingly, both the primary and secondary trends are bullish now.
The charts below highlight the most recent developments. The brown rectangles display the secondary (bearish) reaction that followed the 12/1/22 (GDX) AND 12/2/22 (SIL) bull market highs. The purple rectangles show the rally that followed the 12/19/22 secondary reaction lows that set up both ETFs for a potential primary bear market signal. The blue horizontal lines highlight the primary bull market highs, which were broken up and canceled the secondary reaction and setup for a bear market signal. The red horizontal lines display the secondary reaction closing lows: A confirmed breakdown of such lows would signal a new primary bear market.
B) Market situation if one sticks to the traditional interpretation demanding at least three weeks of movement to declare a secondary reaction.
The primary trend was signaled as bearish on 8/9/2021, as was explained here.
Starting off the 9/26/22 closing lows, a rally ensued that qualifies as a secondary (bullish) reaction against the primary bear market, as I explained HERE.
The pullback that followed the 12/1/22 (GDX) and 12/2/22 (SIL) highs set up both ETFs for a primary bull market signal, as I explained HERE.
On 1/4/23, GDX and SIL broke topside their 12/1/22 (GDX) and 12/2/22 (SIL) secondary reaction closing highs, and, accordingly, a new primary bull market was signaled.
The primary and secondary trends are now bullish. A confirmed breakdown of the 9/26/22 closing lows would signal a primary bear market. This is our first stop loss, which will likely be raised as prices increase and secondary reactions develop—more about the Dow Theory trailing stop HERE.
The Table below displays the unfolding of events. It
starts (Step #1) at the Bear market lows and finishes (Step #4) with the
breakup that signaled the primary bull market.

The charts below highlight the most recent developments. The blue rectangles display the secondary reaction that started off the 9/26/22 bear market lows (red horizontal lines). The brown rectangle shows the pullback that set up both GDX and SIL for a primary bull market. The blue horizontal lines highlight the secondary (bullish) reaction highs, whose breakup signaled a new primary bull market.

Gold and Silver:
While not the object of this post, the trend for GLD and SLV is bullish, as explained HERE.
So, the precious metals arena is bullish, as shown in the table below. Intermarket confirmation is a bullish sign:

Sincerely ,
Manuel Blay
Editor of thedowtheory.com
No comments:
Post a Comment