Gold and silver are in a primary bull market
EXECUTIVE SUMMARY:
1. As a reminder gold and silver are in a primary bull market since 12/1/22, as I explained HERE.
2. The shorter-term appraisal of the trend for SIL and GDX has been bullish since 11/10/22.
3. The longer-term appraisal of the trend for SIL and GDX remains bearish. So, to turn conclusively bullish, I'd like to see this trend becoming bullish too. We are at a make or break moment for the precious metals miners.
GOLD AND SILVER MINERS ETFs
A) Market situation if one appraises secondary reactions not bound by the three weeks dogma.
As I explained here, the primary trend was signaled as bearish on 6/23/22.
The secondary trend was signaled as bearish and the bear market reconfirmed on 8/30/22, as explained here.
On my 11/10/22 post (written before the close),
I explained the existence of a secondary (bullish) reaction against the primary
bear market. I also informed (letter “b” on that post) that a breakup above
the closing highs of the last completed secondary reaction (8/10/22 @27.13
for SIL and 8/12/22 @27.22 for GDX, would signal a new primary bull market.
Well, the awaited breakup occurred at the close of
11/10/22, and, accordingly a primary bull market was signaled. This signal
is based on the confirmed penetration of the closing highs of the last
completed secondary reaction (not the current one, but the previous one). This
is an alternative signal which has been thoroughly discussed in the past
(examples HERE
& HERE).
Our initial stop-loss, to be moved upwards as price
action unfolds, is placed at the close of the last recorded primary bear market
lows (9/26/22). A confirmed violation of such lows would signal a new primary
bear market.
The charts below highlight the details of the new primary bull market signal. The purple rectangles display the last completed secondary reaction, which was terminated by lower lows (small red arrow). The blue horizontal lines highlight the closing highs of such a secondary reaction whose confirmed breakup triggered the new primary bull market. The blue rectangles show the most recent secondary (bullish) reaction, which by want of a proper pullback, did not result in the “typical” setup for a primary bull market. The red horizontal lines highlight the last recorded primary bear market closing lows. Their confirmed breach would signal a new primary bear market. We are very far from that right now. Grey rectangles display rallies that did not manage to qualify as a secondary reaction, and hence, are ignored when applying the Dow Theory.

All in all, the primary and secondary trends for SIL and GDX are bullish.
B) Market situation if one sticks to the traditional interpretation demanding at least three weeks of movement to declare a secondary reaction.
The primary trend was signaled as bearish on 8/9/2021, as was explained here.
Starting off the 9/26/22 closing lows, a rally ensued that qualifies as a secondary (bullish) reaction against the primary bear market, as I explained HERE.
The secondary reaction made its last closing highs on 12/1/22. As of this writing, no pullback reached the Volatility-Adjusted Minimum Movement (VAMM). More about the VAMM here, and, accordingly no set up for a primary bull market signal has been completed.
Absent the “typical” setup, an alternative primary bull market signal would be triggered if the closing highs of the last completed secondary reaction were jointly broken topside. Such highs are:
4/18/22 @40.87 for GDX and,
4/13/22
@39.54 for SIL
As of this writing, SIL and GDX are very far from breaching such lofty price levels.
So now we have three
possible alternatives:
1. If prices continue going up with no intervening >=2 days pullback that satisfies the VAMM, the highs of the last completed secondary reaction are the key price levels to be breached for a new primary bull market.
2. If we get a >=2 days pullback that fulfills the VAMM, then the setup for a potential new primary bull market signal at a lower price level than “1” above would be completed.
3. If following such a pullback, prices continue going down and break down below the 9/26/22 primary bear market lows, the bear market would be reconfirmed and the current secondary reaction terminated.
The charts below display the current technical situation. The purple rectangles display the last completed secondary reaction. The blue horizontal lines highlight the closing highs of such a secondary reaction whose confirmed breakup would trigger a new primary bull market. The blue rectangles show the most recent secondary (bullish) reaction, which by want of a proper pullback, did not result in the “typical” setup for a primary bull market. The red horizontal lines highlight the last recorded primary bear market closing lows. Their confirmed breach would signal a new primary bear market. We are very far from that right now. Grey rectangles display rallies that did not manage to qualify as a secondary reaction, and hence, are ignored when applying the Dow Theory.
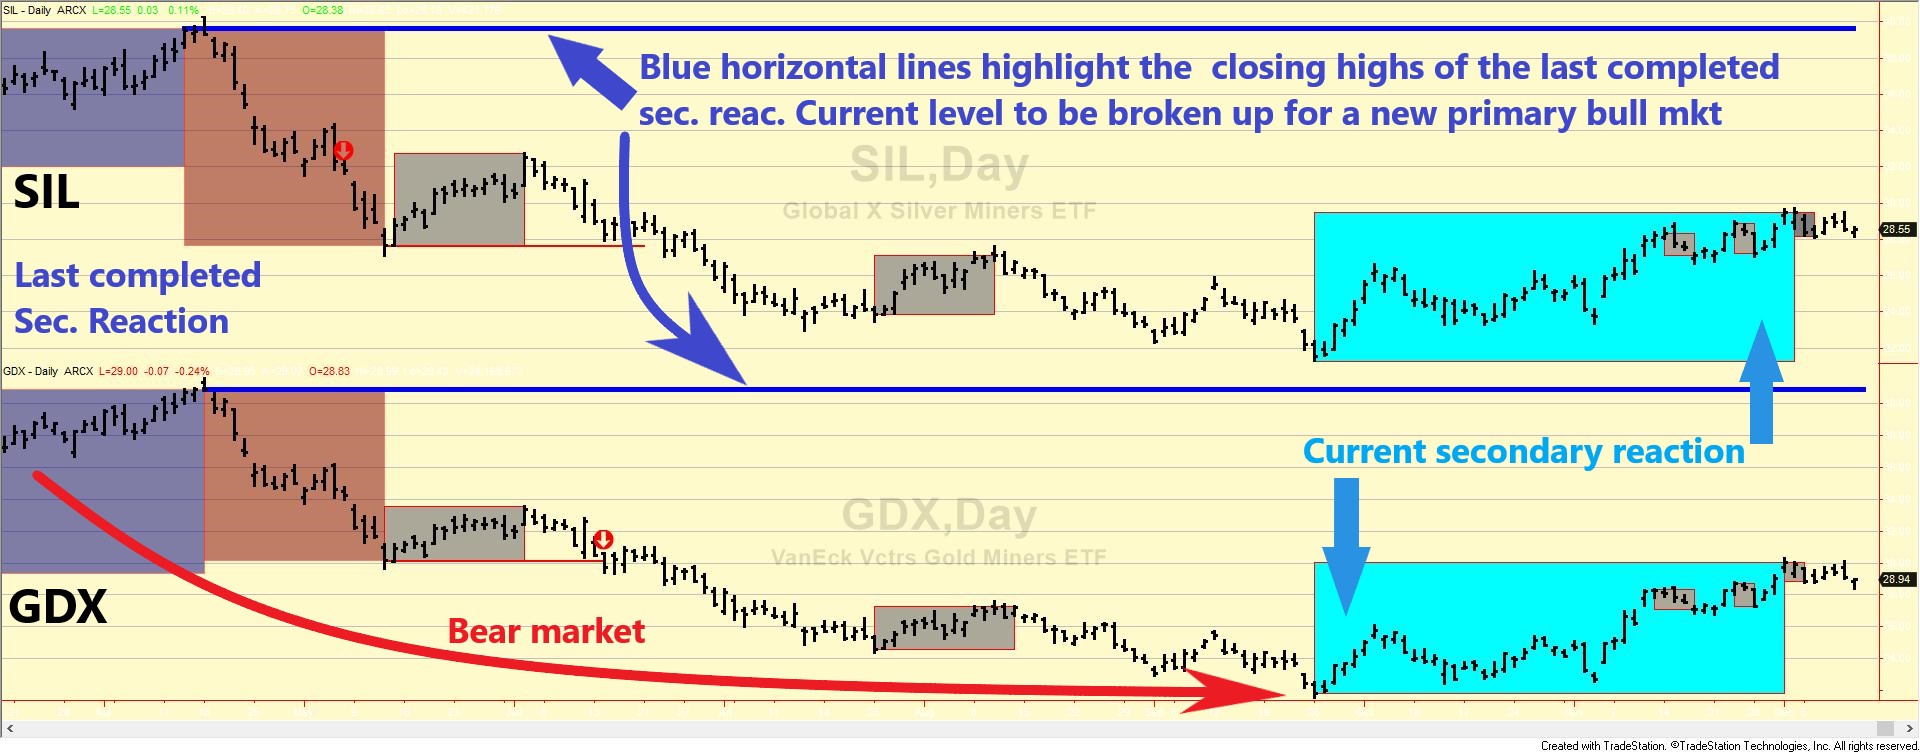
Therefore, the primary trend remains bearish and the secondary one is bullish.
Sincerely,
Manuel Blay
Editor of thedowtheory.com
No comments:
Post a Comment