Setup for a potential primary bear market for GLD and SLV completed
Mark Hulbert, known for his keen market timing insights on MarketWatch, recently shared concerns about the longevity of the current gold bull market. It’s worth noting that excessive bullish sentiment can sometimes signal a bearish outlook. Check out his 2/5/23 article for more details. As I will explain in this post Mark Hulbert may be onto something, as the setup for a potential primeary bear signal for GLD and SLV has been completed. In this post, we give you the relevant price levels to monitor whose violation would signal a new bear market.
General Remarks:
In this post, I thoroughly explained the rationale behind using two alternative definitions to appraise secondary reactions.
A) Market situation if one appraises secondary reactions not bound by the three weeks and 1/3 retracement dogma.
As I explained in this post, the primary trend was signaled as bullish on 11/27/23.
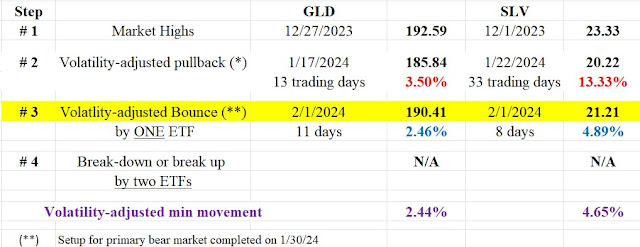
Following their respective 12/1/23 (SLV) and 12/27/23 (GLD) highs (Step #1 in the Table below), the market experienced a pullback until 1/22/24 (SLV) and 1/17/24 (GLD)- Step #2. This pullback met the time and extent requirements for a secondary (bearish) reaction against the primary bullish trend. The subsequent rally, kickstarting from the Step #2 lows, gained enough extent by 1/30/24 to set up GLD and SLV for a potential primary bear market signal. This rally persisted until 2/1/24.
The Table below shows the details:
Therefore, the primary is bullish, and the secondary trend is bearish.
So, now we have the following scenarios:
a) If GLD and SLV jointly breach their respective 1/22/24 (SLV) and 1/17/24 (GLD) lows (Step #2), it would signify the onset of a primary bear market.
b) On the flip side, if GLD and SLV resume their recent rally (Step #3) and jointly surpass their 12/1/23 (GLD) and 12/27/23 (SLV) closing highs (Step #1), it would confirm the continuation of the primary bull market, rendering the secondary reaction null and void.
Take a look at the chart below to visually follow the recent price movements. The brown rectangles mark the secondary reaction (Step #2), while the blue rectangles illustrate the rally (Step #3) that began from the lows of the secondary reaction. The red horizontal lines indicate the pullback lows, the breach of which would signal a “bear market. The blue horizontal lines show the bull market highs (Step #1) to be surpassed to reconfirm the primary bull market.
B) Market situation if one sticks to the traditional interpretation demanding more than three weeks and 1/3 confirmed retracement to declare a secondary reaction.
The secondary reaction against the primary bull market shown in the table above (Step #2) has not reached at least 15 trading days on both ETFs. Therefore, the extent requirement for a secondary reaction has not been met yet. Absent a secondary reaction, the most recent rally is irrelevant. To get a secondary reaction, which is the precondition for a subsequent setup, we need GLD closing below its 1/17/24 lows, in which case the total time below its 1/27/23 highs would be >=15 trading days. Until then, when we take the longer-term view of the Dow Theory, both the primary and secondary trends remain bullish.
Sincerely,
Manuel Blay
Editor of thedowtheory.com


No comments:
Post a Comment