Applying the Confirmation Principle to precious metals
In three earlier analyses (HERE, HERE, and HERE), I showed how the Principle of Confirmation works across U.S. stock indexes, bonds, and crypto. In each case, the principle proved invaluable in filtering out false moves. The idea is simple but powerful: a breakout or breakdown that is not confirmed by a related index or asset is highly suspect and prone to failure.
Today’s case study takes us to the precious metals arena. Silver and gold—tracked through SLV and GLD—gave us two textbook examples of how confirmation can spare investors from costly mistakes. Both instances occurred within the same bull market, and in both cases a hasty reaction to silver’s weakness alone could have prematurely ended one of the most rewarding trades of the past decade.
First “fakeout” Breakdown: June 2024
The story begins with the bull market signaled on April 2, 2024 (details HERE).
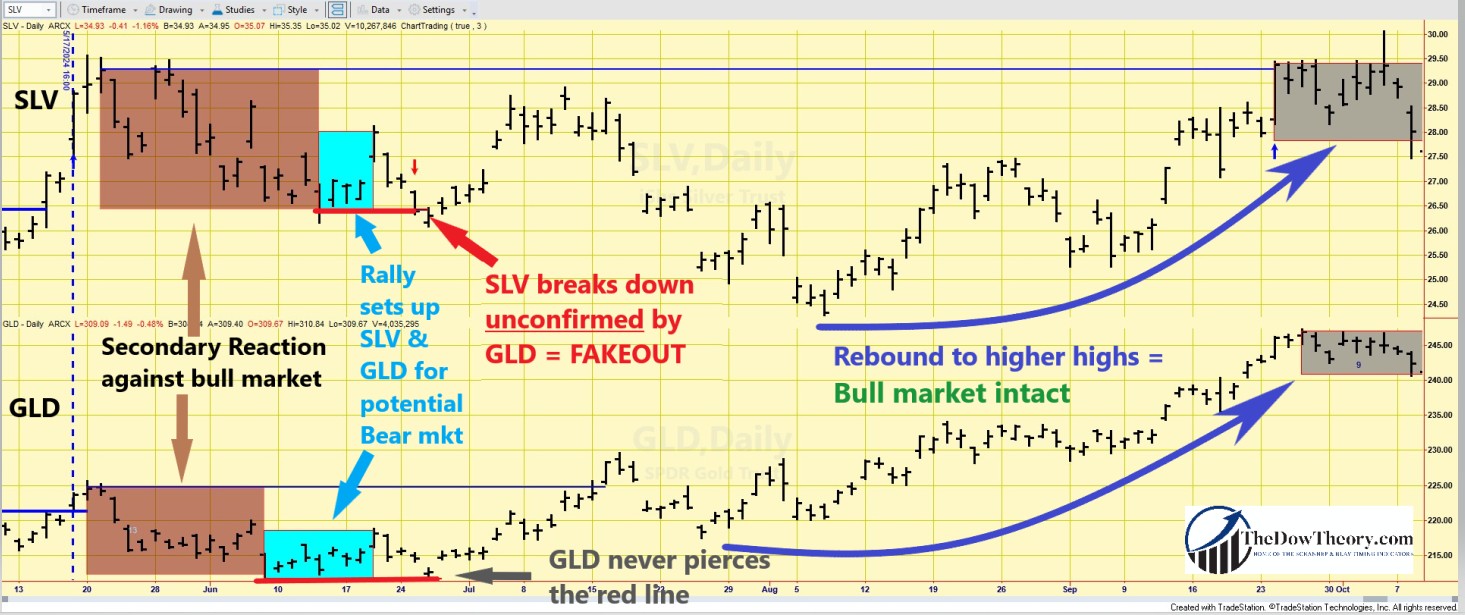
After the 5/21/24 (SLV) and 5/20/24 (GLD) highs, both ETFs pulled back in what qualified as a secondary reaction. Lows were set on 6/13/24 (SLV at 26.43) and 6/7/24 (GLD at 211.6). A subsequent rally faltered, setting the stage for a possible bear market signal (full analysis HERE).
The “line in the sand” was clear: SLV had to hold 26.43, and GLD had to hold 211.6. A confirmed break of both would have killed the young bull market.
Then came the test. On 6/25/24, SLV dropped below its June low, closing at 26.40. GLD also appeared weak, but it never broke its 211.6 threshold. Without confirmation, no signal was triggered. What seemed like a breakdown turned out to be a trap, and the bull market continued.
Both metals soon proved the principle right. GLD posted new highs on 7/16/24, followed by SLV on 9/24/25.
Once again, unconfirmed breakdowns were exposed as false alarms.
This was the first “saving of our skin”, as the chart below shows. The brown rectangles highlight the secondary reaction against the bull market. The blue rectangles display the rally that set up both ETFs for a potential bear market. The red horizontal lines showcase the relevant pullback lows whose confirmed breakdown would have triggered a bear market. The grey rectangles show minor pullbacks that do not qualify as a secondary reaction.
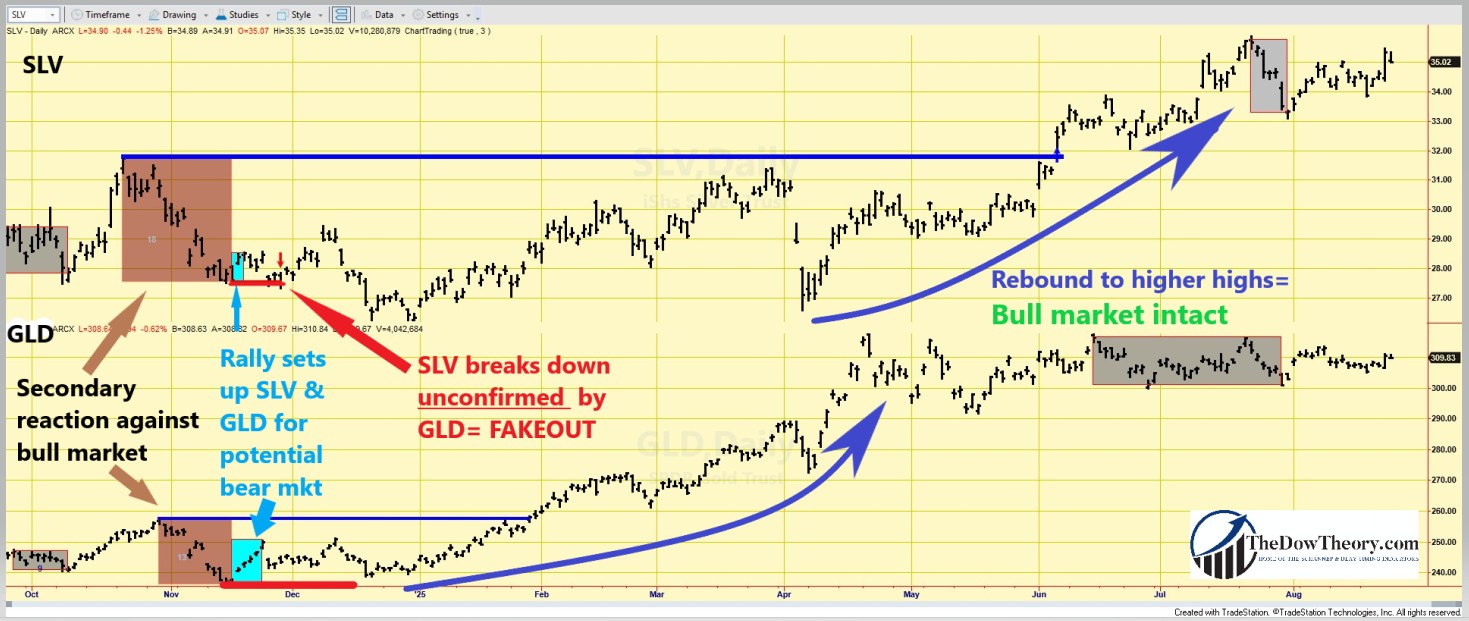
 Second “fakeout” Breakdown: November 2024
The script repeated—but with a twist. After October highs (SLV on 10/22, GLD on 10/30), both metals corrected again, carving out secondary reaction lows on 11/15/24 (SLV at 27.57, GLD at 236.59). Another weak rally fizzled, creating the setup for a new bear market signal (full analysis HERE).
The new critical levels were SLV 27.57 and GLD 236.59. On 11/27/24, SLV cracked support with a close at 27.25. But this time, GLD stayed comfortably above its low. Once again, no confirmation—no signal.
Silver drifted lower for a few more sessions, keeping traders nervous, before surging into a strong rally beginning 12/31/24. The bull case was sealed when GLD broke out on 1/30/25, and SLV followed on 6/5/25. The second “fakeout” had ended just like the first: with confirmation proving its worth.
This was the second “saving of our skin”, as the chart below shows. The brown rectangles highlight the secondary reaction against the bull market. The blue rectangles display the rally that set up both ETFs for a potential bear market. The red horizontal lines showcase the relevant pullback lows whose confirmed breakdown would have triggered a bear market. The grey rectangles show minor pullbacks that do not qualify as a secondary reaction.
Lessons Learned
In both episodes, silver alone signaled danger, but gold refused to confirm. In both cases, investors who relied solely on SLV’s movements would have been forced out of a profitable trade. However, by applying the Principle of Confirmation, the bull market remained intact and continued to be highly profitable both for SLV and GLD.
As we’ve already seen with stocks, bonds, and crypto, confirmation is more than just a Dow Theory curiosity. It’s a practical safeguard that prevents costly whipsaws and helps investors stay aligned with the true primary trend.
In upcoming posts, I will shift from case studies to data, demonstrating how the confirmation principle can be quantified and how significantly it enhances performance compared to single-index signals.
Sincerely,
Manuel Blay
Editor of thedowtheory.com
