Did the Dow Theory help? YES
Today, October 19th, is the 35th anniversary of the 1987 stock market crash. So, it is timely to revisit two posts a penned in the past. Today, I reproduce and update one post I wrote exactly 10 years ago. Tomorrow, I will repost the second one.
How fared those that followed the Dow Theory? Were they spared?
The answer is clear: YES. They were spared.
I will use “classical” Dow Theory with just the Industrials and Transports in this study. I do this because in 1987 Schannep’s improvement, which includes the S&P, was not known yet (or at least was not known to the majority of the public since his seminal book was not published yet). More on Schannep’s book here:
However, even “classical” Dow Theory was responsive enough to keep us on the safe side of the market during the market crash.
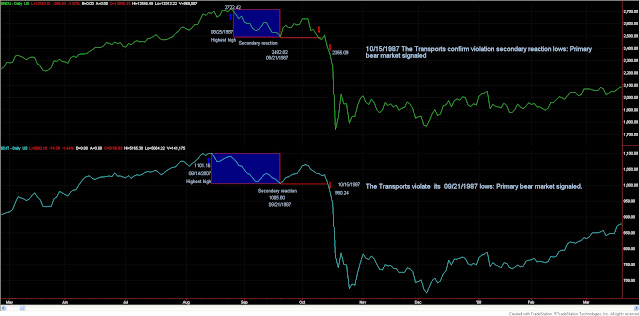
Look at the chart below, which displays the period surrounding the crash.

October 1987 crash: The Dow Theory kept investors protected
We can see that the Dow Industrials made its highest high on 08/25/1987 at 2722.42. The Dow Transportation made its highest high on 08/14/1987 at 1101.16.
From such highs, a secondary reaction developed. The lows of the secondary reaction were jointly made on 09/21/1987. The Industrials’ low was 2492.82, and the Transports’ low was 1005.80. Hence, percentage-wise the Industrials declined by 9.21% and the Transports by 9.48%. The secondary reaction lasted 18 trading days (from 08/25 to 09/21), thus fulfilling the time requirement for a secondary reaction (even for those Dow Theorists who require at least 3 weeks).
A rally ensued that exceeded 3% in both indices. After that, the markets headed south. On 10/09/2012, the Industrials violated the preceding secondary reaction lows of 09/21/1987. However, the Transports didn’t confirm. So, no primary bear market signal was displayed.
On 10/15/1987, the Transports violated its secondary reaction lows giving a Dow Theory primary bear signal. At the close of that day, the Transports stood at 980.24 and the Industrials at 2355.09.
Those nifty investors could have exited at the close. Those less reactive investors should have sold at the open on 10/16/2012 (Friday). Under Dow Theory, there is no excuse for getting out later.
So, how much “lost” Dow Theory investors from the highest high of the Industrials to the exit point at 2355.09? Let’s do the math: (2355.09/2722.42)-1 =
-13.49% Loss for followers of the Dow Theory.
How much was to lose the market from the 2722.42 high to the 1738.74 low? Let’s do the math again: (1738.74 / 2722.42)-1 =
-36.13 % Potential loss for ordinary investors.
No need to use more letters or words. The facts speak for themselves.
And what would have been the numbers if we had used the Schannep version of the Dow Theory? The answer: Even better. According to his book, the loss would have been further reduced by 2.4% (page 114).
This is my Dow Theory way to celebrate the 35th anniversary of Black Monday.
Tomorrow, we'll compare 1987 to the 2020 crash. While both showed similar suddenness and declines, technically were very different.
Sincerely,
Manuel Blay
Editor of thedowtheory.com
No comments:
Post a Comment