Saturday, June 14, 2025

The Real Problem with Buy & Hold—and What to Do About It


Three Smarter Ways to Cut Drawdowns Without Killing Performance

The core issue with buy-and-hold investing is simple: drawdowns. Big ones. They may be inevitable, but that doesn’t make them any less damaging—both financially and psychologically.

To address this, many investors turn to buffered ETFs, hedging with puts, or going short. But there’s a catch: these protective strategies come at a steep price. They can sap performance, require precise execution, and often fail to provide consistent results when you need them most. In short, they cost money—and they typically dilute returns.

Another response is to do… nothing. Just “weather the storm.” After all, markets always recover—right? That’s the theory. But in practice, this approach falters for two big reasons:

  1. Most investors drastically overestimate their tolerance for drawdowns. It’s easy to say, “I can handle a 50% drawdown”—until it actually happens. In real life, drawdowns don’t just hurt portfolios—they wreck confidence and cause people to bail out at the worst possible moment.
  2. The U.S. market is the exception, not the rule. Historically, the S&P 500 has shown an incredible ability to bounce back from deep losses and hit new highs. But many global markets haven’t. European indices, for example, have gone decades without recovering prior peaks. And who’s to say the U.S. will remain exceptional forever?

So what are investors left with?

You can either:
✅ Weather the storm and risk getting crushed by a massive drawdown,
or
✅ Hedge and accept the long-term performance drag that comes with it.

Neither option is ideal.

That’s why I believe in a third path—one that sidesteps both the psychological toll of deep drawdowns and the performance drag of costly hedging. It’s built on three key pillars:

🔹 Market Timing

When properly executed, market timing is one of the very few strategies that can reduce drawdowns without incurring the costs of hedging—and often with the added benefit of outperformance. While it’s often dismissed, the reality is that trend-following and timing approaches, when grounded in data, are both cost-efficient and effective. My Composite Timing Indicator is a key example of such an approach.

The chart belows show the outperformance and marked drawdown reduction of the Composite:

01 graph COMPOSITE VS BUY HOLD year ended 2024

🔹 Sector Rotation

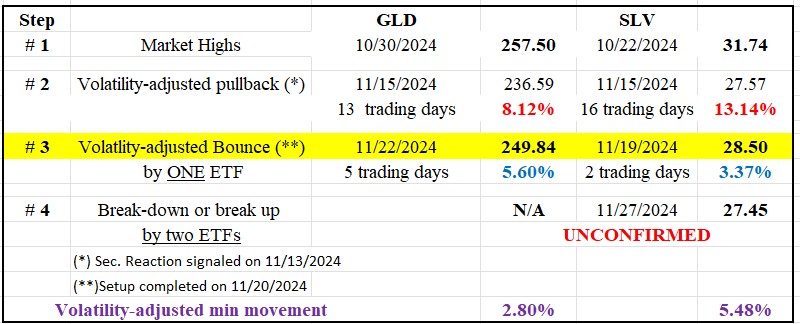
By dynamically shifting exposure across asset classes or market sectors, investors can sidestep underperforming areas and adapt to changing macro conditions. It adds another layer of diversification that helps absorb shocks without relying on expensive hedges. My Dow Theory + High Relative Strength strategy harnesses this principle by combining market timing with exposure to leading sectors.

dow theory relative strength

🔹 Quantitative Stock Selection

Finally, stock picking doesn’t have to be guesswork. Using a quantitative approach to select stocks with a proven statistical edge enhances the overall resilience and return potential of the portfolio—especially when combined with timing and sector rotation. Portfolio 123 is the tool to build a systematic stock selection process that filters out obvious “lemons” and tilts toward winners.

This is an example of what can be achieved with a good stock picking strategy:

Quant based approach

No strategy is perfect, but combining these three elements can provide a robust framework to reduce drawdowns, sidestep prolonged underperformance, and—most importantly—keep you in the game.

Because the real risk isn’t just losing money.
It’s losing the discipline to stay invested when it matters most.

Sincerely,

Manuel Blay

Editor of thedowtheory.com

Tuesday, June 10, 2025

Bull market for the gold and silver miners ETFs (GDX & SIL) signaled on 6/2/25


Overview: The precious metals landscape has turned very bullish. Gold, silver, platinum, and even base metals like copper are trending strongly upward. GDX and SIL are no exception to this new trend.

General Remarks:

In this post, I provide an in-depth explanation of the rationale behind employing two alternative definitions to evaluate secondary reactions.

SIL refers to the Silver Miners ETF. More information about SIL can be found HERE.

GDX refers to the Gold Miners ETF. More information about GDX can be found HERE.

A) Market situation if one appraises secondary reactions not bound by the three weeks and 1/3 retracement dogma.  

As I explained in this post, the trend was signaled as bearish on 12/18/24.

In a clear case of whipsaw, no sooner had the bear signal been triggered than GDX and SIL staged strong rallies, breaking above their previous bull market highs (5/9/25 for SIL at 42.57 and 4/16/25 at 51.91 for GDX). This confirmed breakout occurred on 6/2/25 and shifted the trend to bullish.

The chart below displays the most recent price action. The brown rectangles show the last secondary reaction. The blue rectangles display the rally that set up both ETFs for a primary bear market signal. The red horizontal lines highlight the secondary reaction lows, whose breakdown signaled the end of a primary bear market, and the blue horizontal lines indicate the last recorded primary bull market highs, whose breakup signaled a new primary bull market. The grey rectangles show a bounce that did not meet the time requirement to qualify as a secondary reaction.

307 gdx sil bull market EDITED

So, the primary and secondary trends are bullish.

B) Market situation if one sticks to the traditional interpretation demanding more than three weeks and 1/3 confirmed retracement to declare a secondary reaction.

As I explained in this post, the primary trend was signaled bullish on 3/13/25.

The most recent current drop did not last at least 15 trading days on both ETFs, so there was no secondary reaction, and hence, no change of trend.

Higher confirmed highs have reconfirmed the primary bull market.

Therefore, the primary and secondary trends remain bullish.

Recent price action underscores the importance of analyzing the trend using two alternative time frames. The shorter-term time frame was whipsawed, while the longer-term time frame remained bullish throughout.

Sincerely,

Manuel Blay

Editor of thedowtheory.com


Monday, June 9, 2025

Gold and Silver in Sync: The Bull Marches On


Silver Seals the Deal: Bull Market Reconfirmed 

Overview: On 6/5/25, silver broke above its 10/22/24 highs. It confirmed gold’s previous breakup on 1/30/25. Accordingly, the primary bull market has been confirmed.

By the way, the recent price action of SLV and GLD offers a powerful reminder of how the principle of confirmation can protect you from costly mistakes. If we had focused on SLV alone, we might have been fooled into thinking a new bear market was underway—it was just a fakeout. This post (and the links within) walks you through several real-world examples showing how confirmation helps filter out false signals and adds real value to your trading decisions.

General Remarks:

In this post, I extensively elaborate on the rationale behind employing two alternative definitions to evaluate secondary reactions.

GLD refers to the SPDR® Gold Shares (NYSEArca: GLD®). More information about GLD can be found HERE.

SLV refers to the iShares SLVver Trust (NYSEArca: SLV®). More information about SLV can be found HERE

A) Market situation if one appraises secondary reactions not bound by the three weeks and 1/3 retracement dogma.  

As I explained in this post, the primary trend was signaled as bullish on 4/3/24.

Following the 10/22/24 (SLV) and 10/30/24 (GLD) highs (Step #1 in the table below), there was a pullback until 11/15/24 (Step #2). Such a pullback meets the time and extent requirement for a secondary (bearish) reaction against the still-existing primary bull market. You may find a more in-depth explanation here.

A two-day bounce followed in SLV until 11/19/24, and in GLD until 11/22/24 (Step #3). This bounce met the time (≥2 confirmed days) and extent requirements to set up both precious metals for a potential primary bear market signal.

On 11/27/24, SLV pierced its 11/14/24 lows—unconfirmed by GLD (Step #4). The lack of confirmation meant that no primary bear market was signaled.

The table below displays the price action:


On 1/30/25, GLD surpassed its 10/30/24 highs, unconfirmed by SLV. This lack of confirmation meant that the bull market had not yet been reconfirmed, and the setup for a potential bear market signal remained in force. On 6/5/25, SLV finally surpassed its 10/22/24 highs, confirming GLD’s breakout.

Therefore, the current situation is as follows:
a) The primary bull market has been reconfirmed.
b) The setup for a potential bear market has been canceled.
c) The secondary (bearish) reaction against the bull market has been terminated.

The chart below highlights the price action.

  • The brown rectangles show the secondary reaction against the bull market.
  • The blue rectangles indicate the bounce that set up GLD and SLV for a potential primary bear market signal.
  • The red horizontal lines highlight the secondary reaction lows whose confirmed breakdown would have signaled a new bear market.
  • The blue horizontal lines underline the bull market highs, whose breakout confirms the ongoing bull market.

3065 GLD SLV DOW THEORY chart EDITED

So, the primary and secondary trends are now bullish.

B) Market situation if one sticks to the traditional interpretation demanding more than three weeks and 1/3 confirmed retracement to declare a secondary reaction.

I explained in this post that the primary trend was signaled as bullish on 4/2/24.

The current pullback did not reach 15 confirmed days by both ETFs, so there is no secondary reaction against the bull market.

So, the primary and secondary trends are bullish under the “slower” appraisal of the Dow Theory.

Sincerely,

Manuel Blay

Editor of thedowtheory.com